|
Download Data (XLS File) |
|
||||||||
|
||||||||
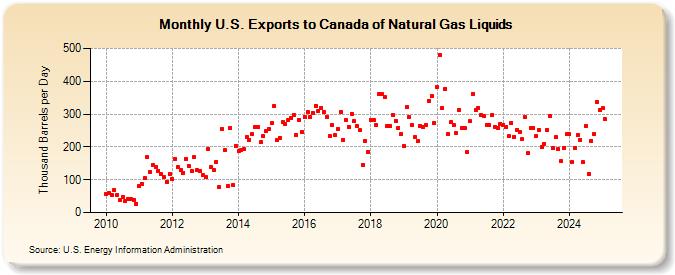
| U.S. Exports to Canada of Natural Gas Liquids (Thousand Barrels per Day) | ||||||||
| Year | Jan | Feb | Mar | Apr | May | Jun | Jul | Aug | Sep | Oct | Nov | Dec |
|---|---|---|---|---|---|---|---|---|---|---|---|---|
| 2010 | 58 | 60 | 55 | 68 | 54 | 37 | 46 | 36 | 40 | 40 | 38 | 27 |
| 2011 | 82 | 87 | 106 | 168 | 124 | 146 | 140 | 128 | 116 | 107 | 94 | 117 |
| 2012 | 102 | 164 | 139 | 129 | 122 | 164 | 141 | 126 | 168 | 129 | 127 | 114 |
| 2013 | 108 | 194 | 138 | 129 | 154 | 78 | 256 | 191 | 82 | 259 | 84 | 204 |
| 2014 | 186 | 191 | 194 | 230 | 222 | 240 | 261 | 262 | 214 | 232 | 249 | 256 |
| 2015 | 272 | 324 | 220 | 228 | 275 | 269 | 281 | 289 | 298 | 236 | 282 | 246 |
| 2016 | 292 | 307 | 290 | 304 | 326 | 310 | 318 | 306 | 292 | 233 | 266 | 235 |
| 2017 | 255 | 307 | 222 | 283 | 262 | 301 | 278 | 264 | 250 | 146 | 218 | 185 |
| 2018 | 283 | 282 | 267 | 361 | 362 | 351 | 263 | 264 | 298 | 280 | 258 | 239 |
| 2019 | 202 | 321 | 291 | 267 | 230 | 217 | 265 | 261 | 267 | 341 | 354 | 273 |
| 2020 | 383 | 480 | 318 | 377 | 238 | 275 | 267 | 241 | 313 | 258 | 257 | 185 |
| 2021 | 278 | 362 | 312 | 319 | 298 | 295 | 267 | 266 | 298 | 262 | 258 | 271 |
| 2022 | 268 | 260 | 232 | 273 | 231 | 252 | 246 | 223 | 290 | 180 | 259 | 257 |
| 2023 | 227 | 236 | 198 | 211 | 132 | 185 | 129 | 137 | 113 | 80 | 195 | 233 |
| 2024 | 238 | |||||||||||
| - = No Data Reported; -- = Not Applicable; NA = Not Available; W = Withheld to avoid disclosure of individual company data. |
| Release Date: 3/29/2024 |
| Next Release Date: 4/30/2024 |