|
Download Data (XLS File) |
|
||||||||
|
||||||||
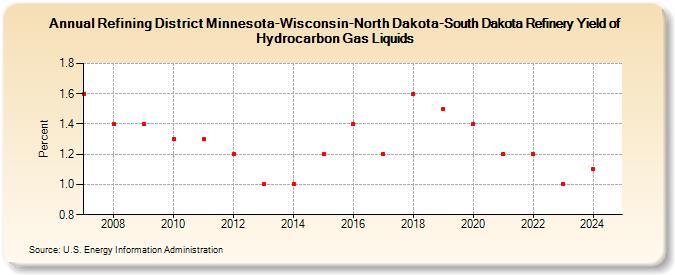
| Refining District Minnesota-Wisconsin-North Dakota-South Dakota Refinery Yield of Hydrocarbon Gas Liquids (Percent) | ||||||||
| Decade | Year-0 | Year-1 | Year-2 | Year-3 | Year-4 | Year-5 | Year-6 | Year-7 | Year-8 | Year-9 |
|---|---|---|---|---|---|---|---|---|---|---|
| 2000's | 1.6 | 1.4 | 1.4 | |||||||
| 2010's | 1.3 | 1.3 | 1.2 | 1.0 | 1.0 | 1.2 | 1.4 | 1.2 | 1.6 | 1.5 |
| 2020's | 1.4 | 1.2 | 1.2 | 0.9 |
| - = No Data Reported; -- = Not Applicable; NA = Not Available; W = Withheld to avoid disclosure of individual company data. |
| Release Date: 3/29/2024 |
| Next Release Date: 8/30/2024 |