|
Download Data (XLS File) |
|
||||||||
|
||||||||
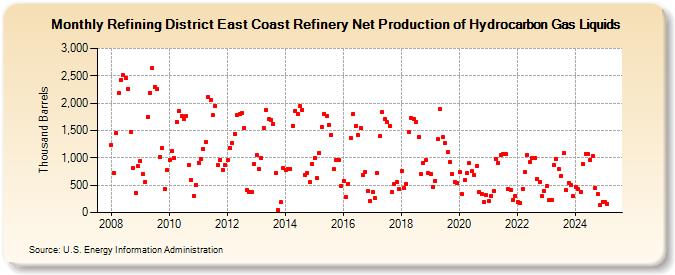
| Refining District East Coast Refinery Net Production of Hydrocarbon Gas Liquids (Thousand Barrels) | ||||||||
| Year | Jan | Feb | Mar | Apr | May | Jun | Jul | Aug | Sep | Oct | Nov | Dec |
|---|---|---|---|---|---|---|---|---|---|---|---|---|
| 2008 | 1,236 | 727 | 1,456 | 2,182 | 2,425 | 2,507 | 2,459 | 2,266 | 1,477 | 816 | 362 | 849 |
| 2009 | 941 | 705 | 565 | 1,754 | 2,190 | 2,636 | 2,298 | 2,257 | 1,021 | 1,183 | 427 | 772 |
| 2010 | 961 | 1,120 | 1,003 | 1,664 | 1,854 | 1,757 | 1,708 | 1,761 | 862 | 600 | 306 | 509 |
| 2011 | 912 | 985 | 1,170 | 1,292 | 2,120 | 2,055 | 1,775 | 1,950 | 869 | 962 | 784 | 866 |
| 2012 | 952 | 1,187 | 1,265 | 1,439 | 1,790 | 1,798 | 1,818 | 1,554 | 411 | 383 | 380 | 894 |
| 2013 | 1,051 | 788 | 1,002 | 1,552 | 1,877 | 1,703 | 1,694 | 1,615 | 719 | 47 | 186 | 814 |
| 2014 | 772 | 799 | 792 | 1,582 | 1,858 | 1,807 | 1,941 | 1,883 | 694 | 723 | 552 | 886 |
| 2015 | 995 | 625 | 1,093 | 1,571 | 1,809 | 1,768 | 1,601 | 1,422 | 788 | 956 | 952 | 489 |
| 2016 | 585 | 284 | 530 | 1,367 | 1,800 | 1,589 | 1,412 | 1,553 | 684 | 744 | 391 | 213 |
| 2017 | 378 | 264 | 716 | 1,397 | 1,837 | 1,705 | 1,646 | 1,589 | 376 | 528 | 553 | 428 |
| 2018 | 761 | 443 | 529 | 1,471 | 1,726 | 1,716 | 1,657 | 1,377 | 696 | 911 | 953 | 726 |
| 2019 | 701 | 468 | 583 | 1,336 | 1,892 | 1,375 | 1,267 | 1,104 | 929 | 703 | 560 | 537 |
| 2020 | 739 | 331 | 596 | 716 | 898 | 754 | 686 | 849 | 377 | 333 | 190 | 325 |
| 2021 | 204 | 305 | 394 | 972 | 908 | 1,052 | 1,073 | 1,067 | 438 | 419 | 238 | 308 |
| 2022 | 195 | 174 | 439 | 739 | 1,052 | 922 | 996 | 1,005 | 616 | 553 | 302 | 400 |
| 2023 | 481 | 223 | 231 | 865 | 971 | 790 | 676 | 1,087 | 411 | 543 | 509 | 300 |
| 2024 | 466 | 423 | 380 | 887 | ||||||||
| - = No Data Reported; -- = Not Applicable; NA = Not Available; W = Withheld to avoid disclosure of individual company data. |
| Release Date: 6/28/2024 |
| Next Release Date: 7/31/2024 |