|
Download Data (XLS File) |
|
||||||||
|
||||||||
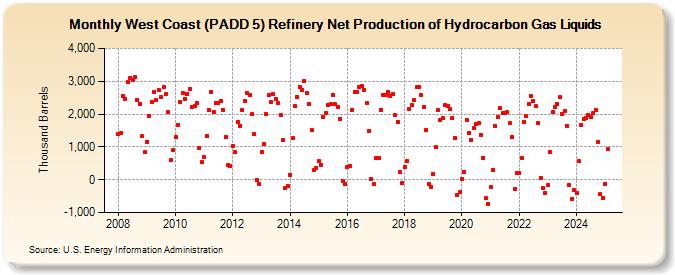
| West Coast (PADD 5) Refinery Net Production of Hydrocarbon Gas Liquids (Thousand Barrels) | ||||||||
| Year | Jan | Feb | Mar | Apr | May | Jun | Jul | Aug | Sep | Oct | Nov | Dec |
|---|---|---|---|---|---|---|---|---|---|---|---|---|
| 2008 | 1,404 | 1,413 | 2,563 | 2,456 | 2,973 | 3,103 | 3,048 | 3,128 | 2,429 | 2,319 | 1,322 | 844 |
| 2009 | 1,155 | 1,926 | 2,382 | 2,685 | 2,416 | 2,741 | 2,517 | 2,819 | 2,622 | 2,053 | 591 | 904 |
| 2010 | 1,307 | 1,674 | 2,359 | 2,646 | 2,445 | 2,619 | 2,777 | 2,201 | 2,236 | 2,352 | 966 | 541 |
| 2011 | 679 | 1,336 | 2,125 | 2,687 | 2,055 | 2,335 | 2,344 | 2,402 | 2,110 | 1,315 | 438 | 427 |
| 2012 | 1,013 | 838 | 1,759 | 1,650 | 2,117 | 2,408 | 2,628 | 2,585 | 1,992 | 1,390 | 5 | -125 |
| 2013 | 859 | 1,089 | 1,995 | 2,571 | 2,353 | 2,600 | 2,472 | 2,325 | 1,970 | 1,216 | -249 | -192 |
| 2014 | 146 | 1,259 | 2,249 | 2,533 | 2,832 | 2,739 | 3,012 | 2,635 | 2,305 | 1,519 | 309 | 343 |
| 2015 | 580 | 463 | 1,915 | 2,018 | 2,291 | 2,304 | 2,579 | 2,293 | 2,223 | 1,858 | -33 | -116 |
| 2016 | 391 | 427 | 2,127 | 2,681 | 2,678 | 2,809 | 2,840 | 2,747 | 2,331 | 1,491 | 17 | -132 |
| 2017 | 652 | 663 | 2,131 | 2,588 | 2,575 | 2,671 | 2,557 | 2,624 | 1,959 | 1,772 | 237 | -87 |
| 2018 | 398 | 574 | 2,155 | 2,275 | 2,428 | 2,810 | 2,834 | 2,580 | 2,224 | 1,507 | -134 | -218 |
| 2019 | 186 | 987 | 2,123 | 1,833 | 1,865 | 2,273 | 2,243 | 2,145 | 1,876 | 1,269 | -465 | -375 |
| 2020 | 16 | 232 | 1,831 | 1,422 | 1,221 | 1,564 | 1,704 | 1,717 | 1,370 | 667 | -570 | -725 |
| 2021 | -234 | 305 | 1,642 | 1,901 | 2,187 | 2,035 | 2,039 | 2,055 | 1,736 | 1,299 | -289 | 205 |
| 2022 | 191 | 670 | 1,773 | 1,933 | 2,320 | 2,553 | 2,392 | 2,243 | 1,736 | 67 | -254 | -406 |
| 2023 | -165 | 851 | 2,061 | 2,205 | 2,317 | 2,506 | 2,015 | 2,082 | 1,645 | -174 | -577 | -327 |
| 2024 | -395 | |||||||||||
| - = No Data Reported; -- = Not Applicable; NA = Not Available; W = Withheld to avoid disclosure of individual company data. |
| Release Date: 3/29/2024 |
| Next Release Date: 4/30/2024 |