|
Download Data (XLS File) |
|
||||||||
|
||||||||
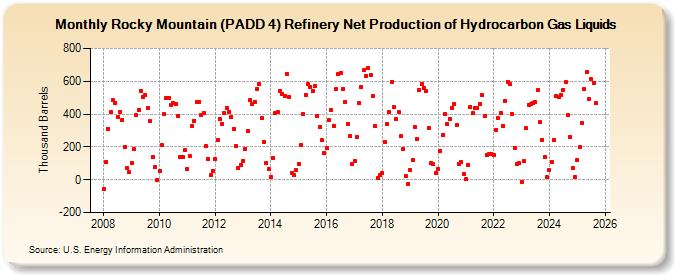
| Rocky Mountain (PADD 4) Refinery Net Production of Hydrocarbon Gas Liquids (Thousand Barrels) | ||||||||
| Year | Jan | Feb | Mar | Apr | May | Jun | Jul | Aug | Sep | Oct | Nov | Dec |
|---|---|---|---|---|---|---|---|---|---|---|---|---|
| 2008 | -59 | 107 | 312 | 412 | 484 | 469 | 381 | 414 | 366 | 202 | 72 | 45 |
| 2009 | 100 | 185 | 394 | 426 | 543 | 505 | 516 | 435 | 355 | 138 | 79 | -1 |
| 2010 | 51 | 209 | 399 | 500 | 498 | 457 | 467 | 461 | 388 | 141 | 140 | 183 |
| 2011 | 63 | 144 | 326 | 360 | 473 | 475 | 394 | 404 | 204 | 126 | 26 | 52 |
| 2012 | 127 | 241 | 370 | 341 | 404 | 434 | 413 | 382 | 312 | 206 | 73 | 88 |
| 2013 | 117 | 189 | 294 | 483 | 464 | 474 | 554 | 582 | 378 | 232 | 103 | 64 |
| 2014 | 18 | 131 | 409 | 413 | 542 | 524 | 513 | 646 | 506 | 41 | 26 | 58 |
| 2015 | 98 | 213 | 399 | 515 | 585 | 564 | 538 | 568 | 386 | 319 | 241 | 162 |
| 2016 | 192 | 361 | 423 | 329 | 551 | 642 | 648 | 554 | 474 | 337 | 267 | 96 |
| 2017 | 112 | 260 | 467 | 562 | 668 | 632 | 683 | 635 | 507 | 327 | 10 | 30 |
| 2018 | 41 | 229 | 339 | 412 | 597 | 445 | 370 | 411 | 264 | 189 | 22 | -23 |
| 2019 | 60 | 121 | 324 | 251 | 547 | 585 | 556 | 538 | 317 | 102 | 94 | 44 |
| 2020 | 68 | 175 | 275 | 399 | 338 | 372 | 436 | 460 | 332 | 95 | 106 | 32 |
| 2021 | 2 | 91 | 444 | 404 | 434 | 436 | 460 | 515 | 387 | 151 | 159 | 157 |
| 2022 | 151 | 305 | 375 | 408 | 330 | 482 | 597 | 581 | 399 | 195 | 94 | 99 |
| 2023 | -11 | 99 | 323 | 457 | 459 | 456 | 480 | 548 | 354 | 245 | 139 | 17 |
| 2024 | 58 | |||||||||||
| - = No Data Reported; -- = Not Applicable; NA = Not Available; W = Withheld to avoid disclosure of individual company data. |
| Release Date: 3/29/2024 |
| Next Release Date: 4/30/2024 |