|
Download Data (XLS File) |
|
||||||||
|
||||||||
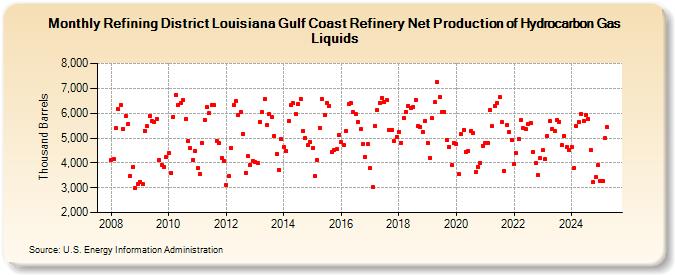
| Refining District Louisiana Gulf Coast Refinery Net Production of Hydrocarbon Gas Liquids (Thousand Barrels) | ||||||||
| Year | Jan | Feb | Mar | Apr | May | Jun | Jul | Aug | Sep | Oct | Nov | Dec |
|---|---|---|---|---|---|---|---|---|---|---|---|---|
| 2008 | 4,126 | 4,138 | 5,393 | 6,157 | 6,334 | 5,383 | 5,869 | 5,566 | 3,474 | 3,846 | 2,972 | 3,135 |
| 2009 | 3,245 | 3,140 | 5,296 | 5,465 | 5,879 | 5,687 | 5,647 | 5,769 | 4,120 | 3,934 | 3,831 | 4,240 |
| 2010 | 4,402 | 3,584 | 5,853 | 6,741 | 6,336 | 6,402 | 6,528 | 5,757 | 4,872 | 4,580 | 4,122 | 4,481 |
| 2011 | 3,792 | 3,547 | 4,817 | 5,745 | 6,232 | 5,993 | 6,330 | 6,322 | 4,893 | 4,792 | 4,186 | 4,063 |
| 2012 | 3,110 | 3,456 | 4,618 | 6,332 | 6,470 | 5,911 | 6,053 | 5,166 | 3,608 | 4,262 | 3,928 | 4,087 |
| 2013 | 4,028 | 4,000 | 5,639 | 6,042 | 6,560 | 5,525 | 5,960 | 5,851 | 5,082 | 4,350 | 3,733 | 4,943 |
| 2014 | 4,650 | 4,458 | 5,680 | 6,327 | 6,399 | 5,963 | 6,389 | 6,584 | 5,276 | 4,996 | 4,704 | 4,845 |
| 2015 | 4,606 | 3,457 | 4,124 | 5,417 | 6,584 | 5,907 | 6,421 | 6,296 | 4,447 | 4,536 | 4,546 | 5,122 |
| 2016 | 4,826 | 4,719 | 5,292 | 6,359 | 6,409 | 6,033 | 5,964 | 5,653 | 5,359 | 4,777 | 4,247 | 4,761 |
| 2017 | 3,784 | 3,021 | 5,500 | 6,123 | 6,424 | 6,604 | 6,456 | 6,528 | 5,339 | 5,323 | 4,876 | 5,051 |
| 2018 | 5,255 | 4,817 | 5,795 | 6,065 | 6,308 | 6,222 | 6,247 | 6,542 | 5,501 | 5,444 | 5,231 | 5,687 |
| 2019 | 4,819 | 4,208 | 5,803 | 6,431 | 7,243 | 6,652 | 6,047 | 6,064 | 4,938 | 4,639 | 3,914 | 4,791 |
| 2020 | 4,760 | 3,538 | 5,170 | 5,336 | 4,452 | 4,484 | 5,285 | 5,185 | 3,614 | 3,837 | 3,985 | 4,691 |
| 2021 | 4,789 | 4,794 | 6,127 | 5,470 | 6,286 | 6,420 | 6,649 | 5,634 | 3,670 | 5,525 | 5,242 | 4,930 |
| 2022 | 3,974 | 4,383 | 4,960 | 5,711 | 5,388 | 5,344 | 5,557 | 5,617 | 4,436 | 3,980 | 3,508 | 4,187 |
| 2023 | 4,504 | 4,137 | 5,071 | 5,684 | 5,367 | 5,296 | 5,730 | 5,662 | 4,707 | 5,089 | 4,632 | 4,512 |
| 2024 | 4,625 | 3,797 | 5,480 | 5,647 | 5,980 | 5,690 | 5,944 | 5,767 | 4,527 | 3,212 | 3,421 | 3,914 |
| 2025 | 3,272 | 3,252 | 4,985 | 5,428 | ||||||||
| - = No Data Reported; -- = Not Applicable; NA = Not Available; W = Withheld to avoid disclosure of individual company data. |
| Release Date: 6/30/2025 |
| Next Release Date: 7/31/2025 |