|
Download Data (XLS File) |
|
||||||||
|
||||||||
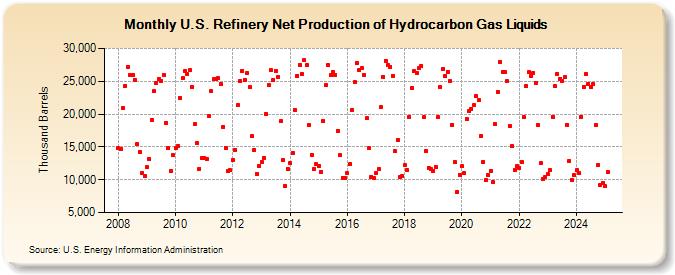
| U.S. Refinery Net Production of Hydrocarbon Gas Liquids (Thousand Barrels) | ||||||||
| Year | Jan | Feb | Mar | Apr | May | Jun | Jul | Aug | Sep | Oct | Nov | Dec |
|---|---|---|---|---|---|---|---|---|---|---|---|---|
| 2008 | 14,808 | 14,690 | 20,950 | 24,274 | 27,204 | 26,023 | 25,956 | 25,245 | 15,376 | 14,265 | 11,055 | 10,585 |
| 2009 | 11,874 | 13,191 | 19,151 | 23,461 | 24,748 | 25,397 | 25,089 | 25,989 | 18,713 | 14,768 | 11,378 | 13,711 |
| 2010 | 14,870 | 15,112 | 22,493 | 25,504 | 26,580 | 26,098 | 26,670 | 24,132 | 18,413 | 15,535 | 11,702 | 13,345 |
| 2011 | 13,347 | 13,213 | 19,702 | 23,437 | 25,267 | 25,406 | 25,429 | 24,524 | 18,077 | 14,866 | 11,302 | 11,422 |
| 2012 | 13,044 | 14,577 | 21,313 | 25,050 | 26,597 | 25,235 | 26,277 | 24,154 | 16,585 | 14,555 | 10,929 | 12,097 |
| 2013 | 12,725 | 13,367 | 20,074 | 24,423 | 26,672 | 25,221 | 26,606 | 25,702 | 18,895 | 12,970 | 9,038 | 11,656 |
| 2014 | 12,571 | 14,133 | 20,649 | 25,803 | 27,489 | 26,113 | 28,184 | 27,520 | 18,307 | 13,772 | 11,603 | 12,341 |
| 2015 | 12,166 | 11,228 | 18,901 | 24,454 | 27,440 | 25,915 | 26,438 | 26,022 | 17,482 | 13,690 | 10,280 | 10,313 |
| 2016 | 10,984 | 12,353 | 20,632 | 24,858 | 27,814 | 26,645 | 27,048 | 25,987 | 19,356 | 14,767 | 10,467 | 10,225 |
| 2017 | 11,002 | 11,563 | 21,015 | 25,708 | 28,149 | 27,456 | 27,192 | 25,847 | 14,320 | 16,109 | 10,453 | 10,577 |
| 2018 | 12,176 | 11,463 | 19,580 | 24,010 | 26,507 | 26,218 | 26,973 | 27,295 | 19,510 | 14,385 | 11,854 | 11,564 |
| 2019 | 11,398 | 12,005 | 19,488 | 24,125 | 26,888 | 25,782 | 26,412 | 24,992 | 18,392 | 12,686 | 8,169 | 10,785 |
| 2020 | 12,023 | 11,056 | 19,251 | 20,484 | 20,802 | 21,312 | 22,697 | 22,073 | 16,664 | 12,705 | 9,999 | 10,756 |
| 2021 | 11,385 | 9,595 | 18,421 | 23,360 | 27,892 | 26,427 | 26,344 | 24,970 | 18,201 | 15,084 | 11,495 | 12,031 |
| 2022 | 11,838 | 12,715 | 19,571 | 24,302 | 26,334 | 25,844 | 26,254 | 24,802 | 18,331 | 12,533 | 10,153 | 10,451 |
| 2023 | 10,904 | 11,453 | 19,636 | 24,165 | 26,120 | 25,368 | 25,098 | 25,601 | 18,391 | 12,857 | 9,995 | 10,703 |
| 2024 | 11,419 | |||||||||||
| - = No Data Reported; -- = Not Applicable; NA = Not Available; W = Withheld to avoid disclosure of individual company data. |
| Release Date: 3/29/2024 |
| Next Release Date: 4/30/2024 |