|
Download Data (XLS File) |
|
||||||||
|
||||||||
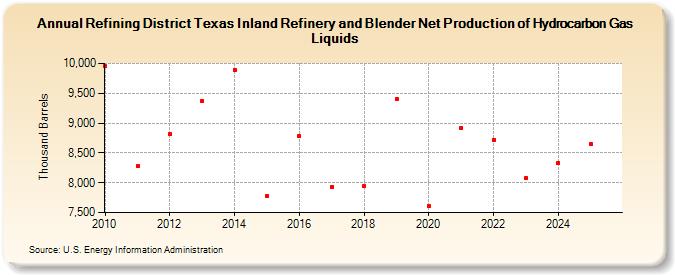
| Refining District Texas Inland Refinery and Blender Net Production of Hydrocarbon Gas Liquids (Thousand Barrels) | ||||||||
| Decade | Year-0 | Year-1 | Year-2 | Year-3 | Year-4 | Year-5 | Year-6 | Year-7 | Year-8 | Year-9 |
|---|---|---|---|---|---|---|---|---|---|---|
| 2010's | 9,955 | 8,284 | 8,817 | 9,371 | 9,893 | 7,774 | 8,782 | 7,933 | 7,947 | 9,409 |
| 2020's | 7,608 | 8,916 | 8,723 | 8,084 |
| - = No Data Reported; -- = Not Applicable; NA = Not Available; W = Withheld to avoid disclosure of individual company data. |
| Release Date: 4/30/2024 |
| Next Release Date: 8/30/2024 |