|
Download Data (XLS File) |
|
||||||||
|
||||||||
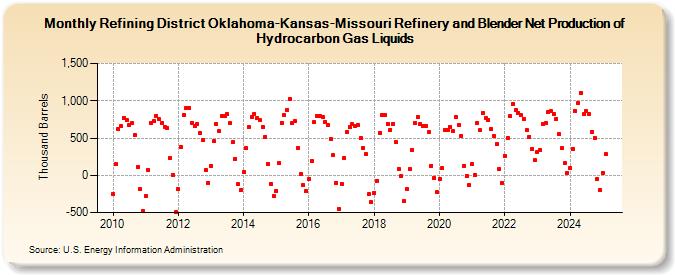
| Refining District Oklahoma-Kansas-Missouri Refinery and Blender Net Production of Hydrocarbon Gas Liquids (Thousand Barrels) | ||||||||
| Year | Jan | Feb | Mar | Apr | May | Jun | Jul | Aug | Sep | Oct | Nov | Dec |
|---|---|---|---|---|---|---|---|---|---|---|---|---|
| 2010 | -250 | 147 | 615 | 663 | 775 | 741 | 668 | 701 | 539 | 114 | -187 | -482 |
| 2011 | -274 | 67 | 705 | 723 | 799 | 749 | 707 | 652 | 632 | 236 | 8 | -497 |
| 2012 | -190 | 384 | 812 | 908 | 909 | 708 | 666 | 688 | 564 | 467 | 73 | -100 |
| 2013 | 131 | 458 | 685 | 593 | 791 | 790 | 820 | 699 | 444 | 223 | -119 | -199 |
| 2014 | 39 | 362 | 644 | 779 | 827 | 766 | 736 | 648 | 514 | 153 | -113 | -279 |
| 2015 | -210 | 163 | 707 | 809 | 878 | 1,028 | 696 | 727 | 372 | 18 | -133 | -213 |
| 2016 | -47 | 194 | 709 | 798 | 801 | 783 | 719 | 680 | 493 | 267 | -98 | -455 |
| 2017 | -112 | 233 | 583 | 647 | 684 | 660 | 681 | 500 | 369 | 281 | -257 | -365 |
| 2018 | -231 | -76 | 571 | 810 | 806 | 690 | 613 | 692 | 442 | 91 | -12 | -343 |
| 2019 | -190 | 87 | 340 | 703 | 779 | 693 | 666 | 664 | 577 | 130 | -37 | -228 |
| 2020 | -52 | 93 | 606 | 605 | 653 | 590 | 778 | 678 | 531 | 131 | -10 | -132 |
| 2021 | 151 | 5 | 705 | 603 | 837 | 775 | 748 | 623 | 530 | 421 | 87 | -102 |
| 2022 | 265 | 503 | 794 | 957 | 870 | 836 | 804 | 761 | 601 | 518 | 346 | 200 |
| 2023 | 314 | 335 | 683 | 704 | 845 | 856 | 817 | 757 | 551 | 365 | 163 | 32 |
| 2024 | 94 | 353 | 866 | 970 | ||||||||
| - = No Data Reported; -- = Not Applicable; NA = Not Available; W = Withheld to avoid disclosure of individual company data. |
| Release Date: 6/28/2024 |
| Next Release Date: 7/31/2024 |