|
Download Data (XLS File) |
|
||||||||
|
||||||||
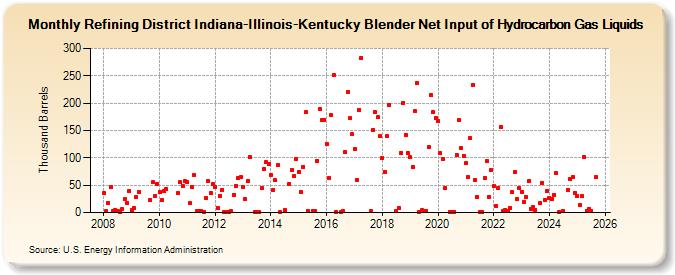
| Refining District Indiana-Illinois-Kentucky Blender Net Input of Hydrocarbon Gas Liquids (Thousand Barrels) | ||||||||
| Year | Jan | Feb | Mar | Apr | May | Jun | Jul | Aug | Sep | Oct | Nov | Dec |
|---|---|---|---|---|---|---|---|---|---|---|---|---|
| 2008 | 35 | 2 | 18 | 47 | 2 | 5 | 3 | 1 | 6 | 25 | 18 | 39 |
| 2009 | 5 | 8 | 28 | 38 | 23 | 55 | 30 | 53 | ||||
| 2010 | 38 | 23 | 40 | 43 | 35 | 55 | 49 | 57 | ||||
| 2011 | 55 | 17 | 47 | 69 | 2 | 2 | 2 | 1 | 27 | 57 | 36 | 52 |
| 2012 | 47 | 9 | 31 | 42 | 1 | 1 | 1 | 2 | 33 | 49 | 64 | 65 |
| 2013 | 47 | 24 | 57 | 101 | 1 | 1 | 1 | 45 | 80 | 92 | 88 | |
| 2014 | 69 | 42 | 59 | 86 | 1 | 4 | 53 | 78 | 67 | 98 | ||
| 2015 | 75 | 38 | 84 | 183 | 3 | 3 | 3 | 95 | 190 | 169 | 169 | |
| 2016 | 126 | 63 | 178 | 252 | 1 | 1 | 2 | 110 | 221 | 172 | 143 | |
| 2017 | 116 | 60 | 188 | 283 | 2 | 151 | 183 | 174 | 139 | |||
| 2018 | 100 | 75 | 139 | 196 | 2 | 8 | 109 | 201 | 142 | 109 | ||
| 2019 | 101 | 83 | 185 | 236 | 1 | 4 | 3 | 3 | 120 | 214 | 183 | 172 |
| 2020 | 168 | 108 | 97 | 44 | 1 | 1 | 1 | 106 | 169 | 118 | 104 | |
| 2021 | 90 | 65 | 136 | 233 | 60 | 28 | 1 | 1 | 63 | 94 | 29 | 78 |
| 2022 | 48 | 12 | 44 | 156 | 3 | 5 | 3 | 9 | 37 | 75 | 24 | 44 |
| 2023 | 38 | 20 | 28 | 57 | 7 | 10 | 5 | 17 | 48 | 23 | 40 | |
| 2024 | 27 | |||||||||||
| - = No Data Reported; -- = Not Applicable; NA = Not Available; W = Withheld to avoid disclosure of individual company data. |
| Release Date: 3/29/2024 |
| Next Release Date: 4/30/2024 |