|
Download Data (XLS File) |
|
||||||||
|
||||||||
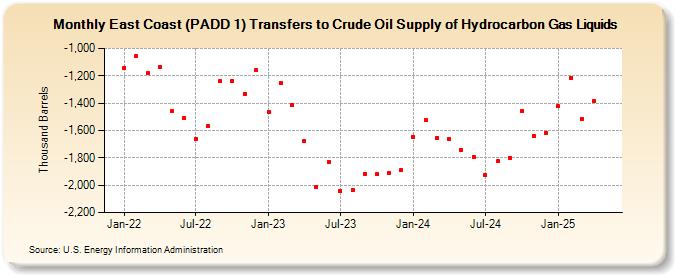
| East Coast (PADD 1) Transfers to Crude Oil Supply of Hydrocarbon Gas Liquids (Thousand Barrels) | ||||||||
| Year | Jan | Feb | Mar | Apr | May | Jun | Jul | Aug | Sep | Oct | Nov | Dec |
|---|---|---|---|---|---|---|---|---|---|---|---|---|
| 2022 | -1,141 | -1,056 | -1,179 | -1,139 | -1,461 | -1,509 | -1,663 | -1,566 | -1,237 | -1,240 | -1,332 | -1,161 |
| 2023 | -1,249 | -1,077 | -1,247 | -1,525 | -1,851 | -1,830 | -2,212 | -1,863 | -1,919 | -1,919 | -1,911 | -1,888 |
| 2024 | -1,647 | -1,520 | ||||||||||
| - = No Data Reported; -- = Not Applicable; NA = Not Available; W = Withheld to avoid disclosure of individual company data. |
| Release Date: 4/30/2024 |
| Next Release Date: 5/31/2024 |