|
Download Data (XLS File) |
|
||||||||
|
||||||||
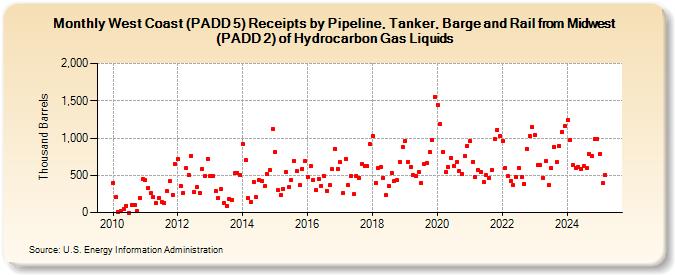
| West Coast (PADD 5) Receipts by Pipeline, Tanker, Barge and Rail from Midwest (PADD 2) of Hydrocarbon Gas Liquids (Thousand Barrels) | ||||||||
| Year | Jan | Feb | Mar | Apr | May | Jun | Jul | Aug | Sep | Oct | Nov | Dec |
|---|---|---|---|---|---|---|---|---|---|---|---|---|
| 2010 | 403 | 205 | 4 | 25 | 48 | 93 | 0 | 107 | 102 | 19 | 194 | 450 |
| 2011 | 431 | 336 | 258 | 205 | 126 | 200 | 144 | 131 | 288 | 420 | 240 | 654 |
| 2012 | 718 | 359 | 264 | 595 | 507 | 761 | 274 | 338 | 267 | 588 | 488 | 725 |
| 2013 | 491 | 488 | 286 | 197 | 310 | 126 | 86 | 186 | 170 | 527 | 532 | 500 |
| 2014 | 915 | 704 | 195 | 136 | 416 | 203 | 440 | 430 | 351 | 519 | 570 | 1,127 |
| 2015 | 817 | 296 | 230 | 322 | 547 | 342 | 439 | 696 | 554 | 365 | 590 | 686 |
| 2016 | 478 | 622 | 442 | 304 | 456 | 360 | 496 | 294 | 364 | 581 | 859 | 591 |
| 2017 | 674 | 261 | 721 | 366 | 489 | 245 | 491 | 467 | 655 | 621 | 620 | 915 |
| 2018 | 1,028 | 398 | 599 | 611 | 465 | 229 | 360 | 535 | 429 | 435 | 683 | 883 |
| 2019 | 961 | 684 | 617 | 500 | 486 | 544 | 399 | 650 | 667 | 814 | 978 | 1,556 |
| 2020 | 1,444 | 1,184 | 819 | 544 | 610 | 737 | 624 | 681 | 555 | 523 | 758 | 898 |
| 2021 | 960 | 684 | 478 | 571 | 550 | 412 | 500 | 466 | 572 | 991 | 1,112 | 1,028 |
| 2022 | 963 | 603 | 485 | 423 | 365 | 477 | 602 | 475 | 384 | 854 | 1,024 | 1,145 |
| 2023 | 1,044 | 637 | 633 | 469 | 691 | 372 | 596 | 885 | 682 | 895 | 1,084 | 1,155 |
| 2024 | 1,052 | |||||||||||
| - = No Data Reported; -- = Not Applicable; NA = Not Available; W = Withheld to avoid disclosure of individual company data. |
| Release Date: 3/29/2024 |
| Next Release Date: 4/30/2024 |