|
Download Data (XLS File) |
|
||||||||
|
||||||||
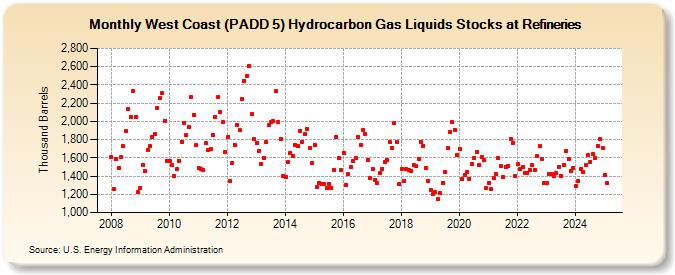
| West Coast (PADD 5) Hydrocarbon Gas Liquids Stocks at Refineries (Thousand Barrels) | ||||||||
| Year | Jan | Feb | Mar | Apr | May | Jun | Jul | Aug | Sep | Oct | Nov | Dec |
|---|---|---|---|---|---|---|---|---|---|---|---|---|
| 2008 | 1,614 | 1,257 | 1,587 | 1,494 | 1,606 | 1,725 | 1,893 | 2,135 | 2,049 | 2,337 | 2,045 | 1,225 |
| 2009 | 1,274 | 1,519 | 1,455 | 1,691 | 1,728 | 1,827 | 1,858 | 2,150 | 2,252 | 2,307 | 2,009 | 1,568 |
| 2010 | 1,569 | 1,524 | 1,406 | 1,473 | 1,569 | 1,775 | 1,981 | 1,846 | 1,937 | 2,265 | 2,073 | 1,736 |
| 2011 | 1,487 | 1,480 | 1,464 | 1,759 | 1,683 | 1,697 | 1,849 | 2,050 | 2,266 | 2,104 | 1,991 | 1,663 |
| 2012 | 1,828 | 1,347 | 1,548 | 1,741 | 1,960 | 1,905 | 2,247 | 2,444 | 2,499 | 2,606 | 2,083 | 1,804 |
| 2013 | 1,760 | 1,676 | 1,533 | 1,602 | 1,775 | 1,957 | 1,998 | 2,003 | 2,332 | 1,995 | 1,805 | 1,401 |
| 2014 | 1,395 | 1,550 | 1,650 | 1,616 | 1,742 | 1,727 | 1,898 | 1,779 | 1,860 | 1,914 | 1,703 | 1,547 |
| 2015 | 1,740 | 1,280 | 1,328 | 1,316 | 1,313 | 1,265 | 1,315 | 1,272 | 1,472 | 1,830 | 1,594 | 1,463 |
| 2016 | 1,650 | 1,305 | 1,420 | 1,495 | 1,567 | 1,601 | 1,828 | 1,743 | 1,904 | 1,863 | 1,581 | 1,376 |
| 2017 | 1,474 | 1,359 | 1,320 | 1,438 | 1,482 | 1,556 | 1,577 | 1,769 | 1,709 | 1,984 | 1,777 | 1,313 |
| 2018 | 1,483 | 1,343 | 1,477 | 1,462 | 1,458 | 1,517 | 1,507 | 1,590 | 1,772 | 1,733 | 1,489 | 1,347 |
| 2019 | 1,249 | 1,199 | 1,222 | 1,144 | 1,213 | 1,322 | 1,442 | 1,708 | 1,883 | 1,989 | 1,908 | 1,631 |
| 2020 | 1,698 | 1,364 | 1,408 | 1,446 | 1,372 | 1,530 | 1,602 | 1,668 | 1,521 | 1,609 | 1,573 | 1,266 |
| 2021 | 1,328 | 1,260 | 1,379 | 1,422 | 1,599 | 1,507 | 1,389 | 1,498 | 1,511 | 1,812 | 1,763 | 1,396 |
| 2022 | 1,529 | 1,476 | 1,495 | 1,436 | 1,434 | 1,464 | 1,521 | 1,471 | 1,622 | 1,725 | 1,588 | 1,321 |
| 2023 | 1,330 | 1,424 | 1,418 | 1,401 | 1,431 | 1,504 | 1,401 | 1,521 | 1,673 | 1,587 | 1,455 | 1,490 |
| 2024 | 1,294 | |||||||||||
| - = No Data Reported; -- = Not Applicable; NA = Not Available; W = Withheld to avoid disclosure of individual company data. |
| Release Date: 3/29/2024 |
| Next Release Date: 4/30/2024 |