|
Download Data (XLS File) |
|
||||||||
|
||||||||
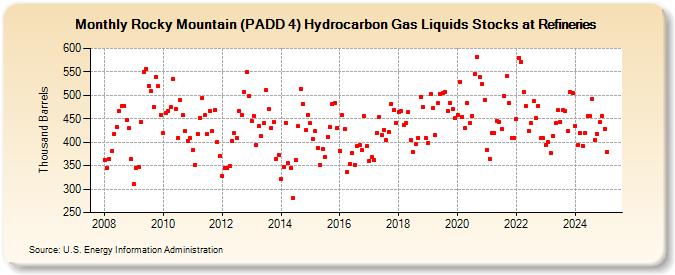
| Rocky Mountain (PADD 4) Hydrocarbon Gas Liquids Stocks at Refineries (Thousand Barrels) | ||||||||
| Year | Jan | Feb | Mar | Apr | May | Jun | Jul | Aug | Sep | Oct | Nov | Dec |
|---|---|---|---|---|---|---|---|---|---|---|---|---|
| 2008 | 363 | 345 | 365 | 381 | 418 | 432 | 466 | 477 | 478 | 447 | 430 | 364 |
| 2009 | 310 | 346 | 347 | 444 | 550 | 556 | 520 | 509 | 476 | 540 | 519 | 458 |
| 2010 | 419 | 463 | 467 | 474 | 535 | 470 | 410 | 489 | 457 | 424 | 403 | 409 |
| 2011 | 383 | 352 | 418 | 452 | 495 | 457 | 418 | 467 | 423 | 469 | 400 | 371 |
| 2012 | 328 | 346 | 344 | 350 | 402 | 419 | 408 | 467 | 459 | 508 | 550 | 499 |
| 2013 | 446 | 456 | 394 | 435 | 413 | 440 | 511 | 470 | 431 | 443 | 364 | 373 |
| 2014 | 322 | 347 | 442 | 355 | 344 | 280 | 361 | 434 | 514 | 482 | 425 | 459 |
| 2015 | 440 | 407 | 423 | 388 | 352 | 386 | 368 | 412 | 432 | 481 | 484 | 431 |
| 2016 | 382 | 457 | 429 | 337 | 354 | 376 | 352 | 392 | 393 | 383 | 455 | 391 |
| 2017 | 360 | 368 | 362 | 420 | 453 | 415 | 427 | 404 | 422 | 482 | 468 | 442 |
| 2018 | 465 | 466 | 436 | 441 | 464 | 405 | 379 | 396 | 409 | 497 | 474 | 409 |
| 2019 | 399 | 502 | 473 | 415 | 483 | 502 | 505 | 508 | 467 | 484 | 470 | 451 |
| 2020 | 459 | 529 | 454 | 430 | 483 | 441 | 456 | 545 | 582 | 538 | 524 | 490 |
| 2021 | 384 | 365 | 419 | 419 | 446 | 444 | 429 | 499 | 541 | 484 | 410 | 410 |
| 2022 | 450 | 580 | 572 | 507 | 477 | 424 | 442 | 487 | 451 | 478 | 408 | 408 |
| 2023 | 393 | 389 | 383 | 414 | 440 | 464 | 444 | 468 | 467 | 423 | 507 | 505 |
| 2024 | 435 | |||||||||||
| - = No Data Reported; -- = Not Applicable; NA = Not Available; W = Withheld to avoid disclosure of individual company data. |
| Release Date: 3/29/2024 |
| Next Release Date: 4/30/2024 |