|
Download Data (XLS File) |
|
||||||||
|
||||||||
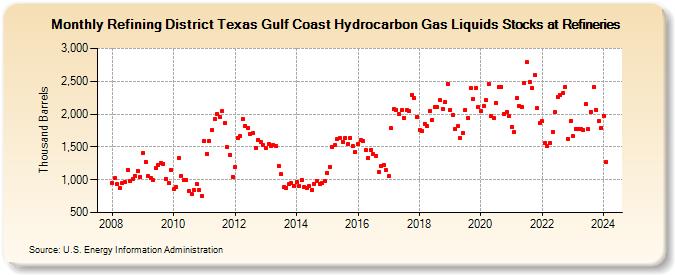
| Refining District Texas Gulf Coast Hydrocarbon Gas Liquids Stocks at Refineries (Thousand Barrels) | ||||||||
| Year | Jan | Feb | Mar | Apr | May | Jun | Jul | Aug | Sep | Oct | Nov | Dec |
|---|---|---|---|---|---|---|---|---|---|---|---|---|
| 2008 | 954 | 1,025 | 932 | 869 | 943 | 970 | 1,149 | 988 | 1,014 | 1,056 | 1,140 | 1,045 |
| 2009 | 1,406 | 1,274 | 1,050 | 1,029 | 989 | 1,179 | 1,221 | 1,256 | 1,244 | 1,017 | 949 | 1,154 |
| 2010 | 854 | 883 | 1,326 | 1,064 | 991 | 997 | 829 | 780 | 849 | 932 | 842 | 753 |
| 2011 | 1,589 | 1,399 | 1,593 | 1,760 | 1,919 | 2,003 | 1,952 | 2,040 | 1,871 | 1,493 | 1,382 | 1,048 |
| 2012 | 1,187 | 1,641 | 1,662 | 1,921 | 1,822 | 1,788 | 1,703 | 1,714 | 1,488 | 1,605 | 1,571 | 1,527 |
| 2013 | 1,477 | 1,544 | 1,516 | 1,533 | 1,513 | 1,212 | 1,080 | 889 | 879 | 928 | 950 | 910 |
| 2014 | 963 | 907 | 992 | 886 | 881 | 902 | 840 | 937 | 985 | 939 | 957 | 978 |
| 2015 | 1,104 | 1,201 | 1,494 | 1,527 | 1,613 | 1,633 | 1,580 | 1,640 | 1,539 | 1,639 | 1,507 | 1,423 |
| 2016 | 1,538 | 1,601 | 1,586 | 1,455 | 1,334 | 1,447 | 1,391 | 1,365 | 1,116 | 1,208 | 1,230 | 1,147 |
| 2017 | 1,052 | 1,781 | 2,071 | 2,068 | 1,996 | 2,056 | 1,947 | 2,063 | 2,044 | 2,294 | 2,238 | 1,959 |
| 2018 | 1,760 | 1,738 | 1,853 | 1,821 | 2,048 | 1,915 | 2,114 | 2,100 | 2,210 | 2,080 | 2,181 | 2,463 |
| 2019 | 2,064 | 1,989 | 1,774 | 1,813 | 1,634 | 1,715 | 2,067 | 1,940 | 2,395 | 2,236 | 2,401 | 2,105 |
| 2020 | 2,045 | 2,121 | 2,211 | 2,464 | 1,974 | 1,942 | 2,161 | 2,405 | 2,416 | 2,001 | 2,030 | 1,971 |
| 2021 | 1,803 | 1,725 | 2,248 | 2,123 | 2,108 | 2,476 | 2,787 | 2,488 | 2,402 | 2,595 | 2,090 | 1,860 |
| 2022 | 1,889 | 1,563 | 1,518 | 1,561 | 1,733 | 2,031 | 2,260 | 2,285 | 2,321 | 2,415 | 1,626 | 1,893 |
| 2023 | 1,664 | 1,773 | 1,772 | 1,778 | 1,757 | 2,152 | 1,769 | 2,038 | 2,410 | 2,069 | 1,892 | 1,792 |
| 2024 | 1,967 | |||||||||||
| - = No Data Reported; -- = Not Applicable; NA = Not Available; W = Withheld to avoid disclosure of individual company data. |
| Release Date: 3/29/2024 |
| Next Release Date: 4/30/2024 |