|
Download Data (XLS File) |
|
||||||||
|
||||||||
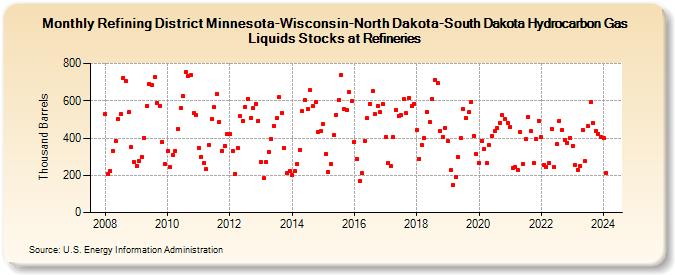
| Refining District Minnesota-Wisconsin-North Dakota-South Dakota Hydrocarbon Gas Liquids Stocks at Refineries (Thousand Barrels) | ||||||||
| Year | Jan | Feb | Mar | Apr | May | Jun | Jul | Aug | Sep | Oct | Nov | Dec |
|---|---|---|---|---|---|---|---|---|---|---|---|---|
| 2008 | 528 | 209 | 222 | 330 | 382 | 501 | 528 | 724 | 704 | 538 | 351 | 269 |
| 2009 | 250 | 278 | 298 | 402 | 573 | 692 | 683 | 726 | 589 | 574 | 378 | 258 |
| 2010 | 329 | 242 | 310 | 333 | 449 | 563 | 625 | 755 | 733 | 736 | 534 | 521 |
| 2011 | 348 | 299 | 266 | 232 | 365 | 501 | 564 | 638 | 487 | 333 | 357 | 422 |
| 2012 | 421 | 333 | 209 | 348 | 517 | 494 | 569 | 612 | 510 | 560 | 583 | 493 |
| 2013 | 272 | 185 | 270 | 327 | 397 | 467 | 505 | 618 | 535 | 347 | 212 | 223 |
| 2014 | 200 | 221 | 260 | 338 | 543 | 602 | 554 | 656 | 570 | 591 | 431 | 436 |
| 2015 | 473 | 315 | 218 | 260 | 414 | 524 | 605 | 739 | 556 | 550 | 645 | 597 |
| 2016 | 381 | 289 | 169 | 210 | 382 | 505 | 583 | 652 | 527 | 574 | 537 | 580 |
| 2017 | 406 | 265 | 251 | 408 | 551 | 518 | 523 | 609 | 532 | 617 | 571 | 584 |
| 2018 | 442 | 288 | 364 | 398 | 537 | 487 | 608 | 713 | 695 | 435 | 408 | 456 |
| 2019 | 384 | 226 | 147 | 190 | 298 | 398 | 555 | 507 | 538 | 595 | 412 | 313 |
| 2020 | 267 | 386 | 340 | 264 | 361 | 413 | 435 | 456 | 482 | 522 | 502 | 483 |
| 2021 | 457 | 241 | 246 | 228 | 432 | 262 | 393 | 513 | 435 | 268 | 394 | 493 |
| 2022 | 404 | 256 | 244 | 264 | 451 | 245 | 366 | 494 | 445 | 392 | 375 | 399 |
| 2023 | 359 | 254 | 230 | 251 | 443 | 275 | 463 | 592 | 478 | 439 | 423 | 404 |
| 2024 | 399 | |||||||||||
| - = No Data Reported; -- = Not Applicable; NA = Not Available; W = Withheld to avoid disclosure of individual company data. |
| Release Date: 3/29/2024 |
| Next Release Date: 4/30/2024 |