|
Download Data (XLS File) |
|
||||||||
|
||||||||
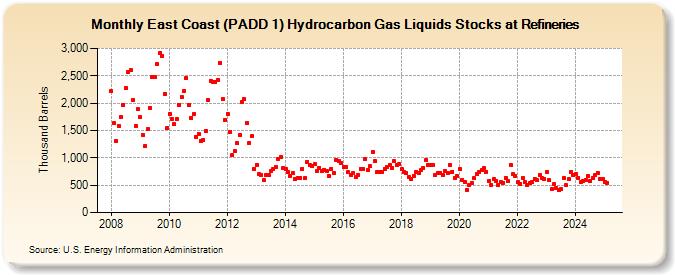
| East Coast (PADD 1) Hydrocarbon Gas Liquids Stocks at Refineries (Thousand Barrels) | ||||||||
| Year | Jan | Feb | Mar | Apr | May | Jun | Jul | Aug | Sep | Oct | Nov | Dec |
|---|---|---|---|---|---|---|---|---|---|---|---|---|
| 2008 | 2,215 | 1,631 | 1,312 | 1,587 | 1,745 | 1,972 | 2,281 | 2,568 | 2,600 | 2,061 | 1,588 | 1,886 |
| 2009 | 1,738 | 1,425 | 1,216 | 1,523 | 1,914 | 2,478 | 2,473 | 2,713 | 2,912 | 2,867 | 2,164 | 1,544 |
| 2010 | 1,807 | 1,712 | 1,610 | 1,713 | 1,974 | 2,110 | 2,230 | 2,463 | 1,960 | 1,730 | 1,797 | 1,386 |
| 2011 | 1,433 | 1,316 | 1,329 | 1,488 | 2,051 | 2,413 | 2,394 | 2,377 | 2,429 | 2,741 | 2,077 | 1,697 |
| 2012 | 1,805 | 1,481 | 1,043 | 1,122 | 1,273 | 1,414 | 2,017 | 2,069 | 1,643 | 1,269 | 1,397 | 803 |
| 2013 | 876 | 709 | 683 | 589 | 680 | 682 | 755 | 795 | 837 | 987 | 1,015 | 819 |
| 2014 | 801 | 745 | 675 | 720 | 606 | 638 | 634 | 804 | 631 | 925 | 864 | 846 |
| 2015 | 883 | 756 | 823 | 762 | 784 | 753 | 668 | 804 | 730 | 969 | 939 | 905 |
| 2016 | 839 | 831 | 734 | 682 | 727 | 646 | 683 | 805 | 797 | 980 | 779 | 844 |
| 2017 | 1,114 | 937 | 749 | 735 | 742 | 802 | 824 | 869 | 811 | 934 | 878 | 883 |
| 2018 | 790 | 740 | 718 | 650 | 607 | 677 | 742 | 725 | 778 | 818 | 956 | 878 |
| 2019 | 867 | 868 | 690 | 716 | 722 | 690 | 765 | 731 | 871 | 748 | 638 | 663 |
| 2020 | 795 | 601 | 552 | 417 | 504 | 535 | 623 | 696 | 741 | 774 | 806 | 749 |
| 2021 | 573 | 506 | 608 | 573 | 505 | 554 | 549 | 640 | 568 | 868 | 700 | 676 |
| 2022 | 551 | 530 | 629 | 550 | 506 | 534 | 556 | 621 | 590 | 688 | 629 | 618 |
| 2023 | 748 | 587 | 430 | 514 | 443 | 409 | 425 | 636 | 498 | 607 | 746 | 691 |
| 2024 | 709 | |||||||||||
| - = No Data Reported; -- = Not Applicable; NA = Not Available; W = Withheld to avoid disclosure of individual company data. |
| Release Date: 3/29/2024 |
| Next Release Date: 4/30/2024 |