|
Download Data (XLS File) |
|
||||||||
|
||||||||
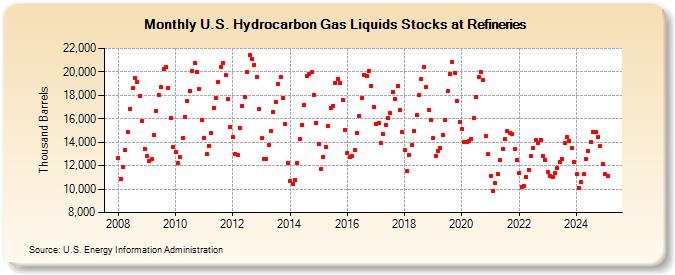
| U.S. Hydrocarbon Gas Liquids Stocks at Refineries (Thousand Barrels) | ||||||||
| Year | Jan | Feb | Mar | Apr | May | Jun | Jul | Aug | Sep | Oct | Nov | Dec |
|---|---|---|---|---|---|---|---|---|---|---|---|---|
| 2008 | 12,644 | 10,837 | 11,905 | 13,336 | 14,864 | 16,855 | 18,588 | 19,502 | 19,106 | 17,947 | 15,825 | 13,453 |
| 2009 | 12,855 | 12,390 | 12,526 | 14,645 | 16,629 | 17,992 | 18,677 | 20,273 | 20,383 | 18,652 | 16,104 | 13,617 |
| 2010 | 13,131 | 12,199 | 12,763 | 14,399 | 16,142 | 17,518 | 18,382 | 20,092 | 20,722 | 19,962 | 18,541 | 15,867 |
| 2011 | 14,371 | 12,979 | 13,683 | 14,745 | 16,923 | 17,780 | 19,170 | 20,428 | 20,795 | 19,692 | 17,668 | 15,324 |
| 2012 | 14,413 | 12,971 | 12,891 | 15,235 | 17,097 | 17,894 | 19,960 | 21,426 | 21,119 | 20,568 | 19,537 | 16,818 |
| 2013 | 14,342 | 12,575 | 12,583 | 13,781 | 14,944 | 16,589 | 17,458 | 19,004 | 19,539 | 17,767 | 15,520 | 12,257 |
| 2014 | 10,731 | 10,439 | 10,747 | 12,237 | 14,303 | 15,447 | 17,208 | 19,606 | 19,831 | 20,001 | 18,032 | 15,680 |
| 2015 | 13,825 | 11,738 | 12,776 | 13,600 | 15,398 | 16,896 | 17,126 | 19,017 | 19,429 | 19,036 | 17,590 | 15,043 |
| 2016 | 13,081 | 12,704 | 12,790 | 13,355 | 14,798 | 16,227 | 17,749 | 19,726 | 19,628 | 20,114 | 18,813 | 17,032 |
| 2017 | 15,568 | 15,661 | 13,913 | 14,700 | 15,446 | 16,059 | 16,459 | 18,260 | 17,650 | 18,799 | 16,728 | 14,836 |
| 2018 | 13,308 | 11,535 | 12,908 | 13,734 | 14,948 | 16,312 | 17,990 | 19,412 | 20,442 | 18,668 | 16,781 | 15,867 |
| 2019 | 14,377 | 12,817 | 13,216 | 13,514 | 14,621 | 15,897 | 18,336 | 19,811 | 20,879 | 19,908 | 17,510 | 15,703 |
| 2020 | 15,115 | 13,985 | 14,043 | 14,067 | 14,288 | 16,075 | 17,831 | 19,590 | 19,971 | 19,277 | 14,508 | 12,975 |
| 2021 | 11,120 | 9,852 | 10,517 | 11,290 | 12,442 | 13,439 | 14,275 | 14,944 | 14,792 | 14,727 | 13,426 | 12,476 |
| 2022 | 11,374 | 10,168 | 10,268 | 11,060 | 11,670 | 12,784 | 13,467 | 14,148 | 13,917 | 14,198 | 12,807 | 12,449 |
| 2023 | 11,443 | 11,120 | 11,114 | 11,375 | 11,781 | 12,307 | 12,579 | 13,933 | 14,426 | 14,123 | 13,497 | 12,347 |
| 2024 | 11,260 | |||||||||||
| - = No Data Reported; -- = Not Applicable; NA = Not Available; W = Withheld to avoid disclosure of individual company data. |
| Release Date: 3/29/2024 |
| Next Release Date: 4/30/2024 |