|
Download Data (XLS File) |
|
||||||||
|
||||||||
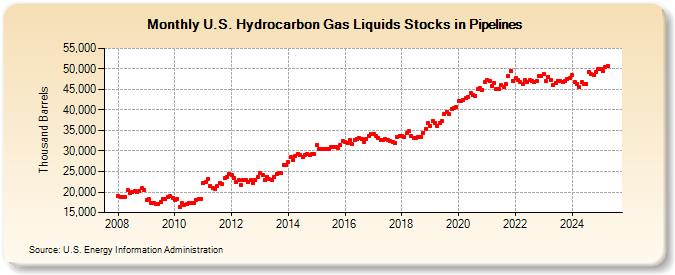
| U.S. Hydrocarbon Gas Liquids Stocks in Pipelines (Thousand Barrels) | ||||||||
| Year | Jan | Feb | Mar | Apr | May | Jun | Jul | Aug | Sep | Oct | Nov | Dec |
|---|---|---|---|---|---|---|---|---|---|---|---|---|
| 2008 | 18,987 | 18,723 | 18,880 | 18,761 | 20,405 | 19,677 | 19,978 | 20,220 | 19,954 | 20,152 | 20,870 | 20,579 |
| 2009 | 18,160 | 18,193 | 17,338 | 17,274 | 17,129 | 17,089 | 17,586 | 18,272 | 18,243 | 18,765 | 18,971 | 18,591 |
| 2010 | 18,071 | 18,313 | 16,314 | 17,284 | 16,886 | 16,995 | 17,415 | 17,261 | 17,422 | 18,088 | 18,420 | 18,384 |
| 2011 | 22,298 | 22,362 | 23,218 | 21,509 | 21,048 | 20,659 | 21,417 | 22,196 | 21,917 | 23,324 | 23,683 | 24,432 |
| 2012 | 24,090 | 23,396 | 22,438 | 22,848 | 21,793 | 22,902 | 22,927 | 22,497 | 22,918 | 22,295 | 22,969 | 23,589 |
| 2013 | 24,680 | 24,115 | 22,894 | 23,637 | 23,064 | 23,032 | 23,780 | 24,382 | 24,739 | 24,578 | 26,636 | 26,536 |
| 2014 | 27,233 | 28,426 | 27,862 | 28,752 | 29,308 | 29,078 | 28,468 | 29,123 | 29,339 | 29,143 | 29,242 | 29,310 |
| 2015 | 31,443 | 30,469 | 30,402 | 30,478 | 30,402 | 30,514 | 30,885 | 31,044 | 30,855 | 30,750 | 31,430 | 32,336 |
| 2016 | 32,078 | 32,011 | 32,619 | 31,680 | 32,698 | 32,866 | 33,113 | 32,913 | 32,220 | 33,014 | 33,697 | 34,255 |
| 2017 | 34,070 | 33,694 | 33,090 | 32,691 | 32,627 | 32,866 | 32,743 | 32,343 | 32,110 | 31,993 | 33,518 | 33,759 |
| 2018 | 33,653 | 33,368 | 34,400 | 34,778 | 33,698 | 33,224 | 33,236 | 33,423 | 33,457 | 34,462 | 35,479 | 36,818 |
| 2019 | 36,103 | 37,412 | 36,798 | 36,016 | 36,817 | 37,417 | 39,091 | 39,418 | 38,912 | 40,271 | 40,510 | 40,708 |
| 2020 | 42,156 | 42,218 | 42,459 | 42,908 | 43,175 | 44,252 | 43,537 | 43,472 | 45,010 | 45,232 | 44,928 | 46,761 |
| 2021 | 47,249 | 47,041 | 45,756 | 46,602 | 45,199 | 45,081 | 46,000 | 45,623 | 46,308 | 48,172 | 49,463 | 47,089 |
| 2022 | 47,848 | 47,326 | 46,714 | 46,388 | 47,237 | 46,788 | 47,201 | 47,165 | 46,860 | 46,970 | 48,184 | 48,328 |
| 2023 | 48,902 | 47,103 | 48,249 | 47,432 | 46,128 | 46,438 | 46,864 | 46,959 | 48,675 | 47,034 | 47,594 | 47,786 |
| 2024 | 48,451 | 46,778 | 46,362 | 45,508 | ||||||||
| - = No Data Reported; -- = Not Applicable; NA = Not Available; W = Withheld to avoid disclosure of individual company data. |
| Release Date: 6/28/2024 |
| Next Release Date: 7/31/2024 |