|
Download Data (XLS File) |
|
||||||||
|
||||||||
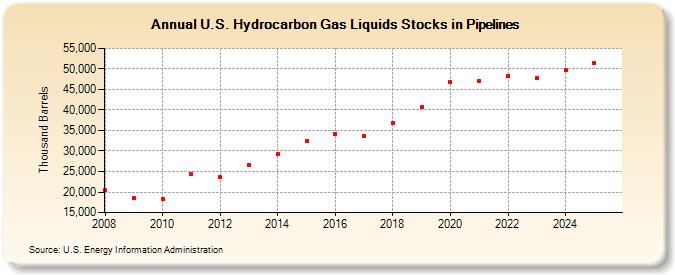
| U.S. Hydrocarbon Gas Liquids Stocks in Pipelines (Thousand Barrels) | ||||||||
| Decade | Year-0 | Year-1 | Year-2 | Year-3 | Year-4 | Year-5 | Year-6 | Year-7 | Year-8 | Year-9 |
|---|---|---|---|---|---|---|---|---|---|---|
| 2000's | 20,579 | 18,591 | ||||||||
| 2010's | 18,384 | 24,432 | 23,589 | 26,536 | 29,310 | 32,336 | 34,255 | 33,759 | 36,818 | 40,708 |
| 2020's | 46,761 | 47,089 | 48,328 | 47,691 |
| - = No Data Reported; -- = Not Applicable; NA = Not Available; W = Withheld to avoid disclosure of individual company data. |
| Release Date: 8/30/2024 |
| Next Release Date: 8/29/2025 |