|
Download Data (XLS File) |
|
||||||||
|
||||||||
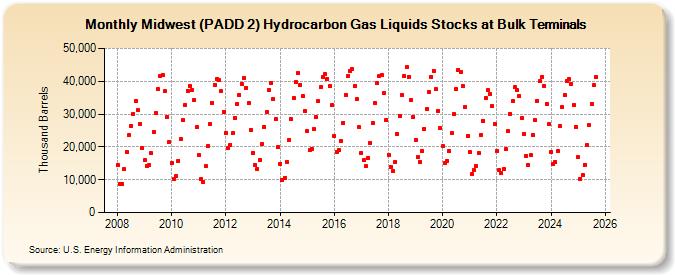
| Midwest (PADD 2) Hydrocarbon Gas Liquids Stocks at Bulk Terminals (Thousand Barrels) | ||||||||
| Year | Jan | Feb | Mar | Apr | May | Jun | Jul | Aug | Sep | Oct | Nov | Dec |
|---|---|---|---|---|---|---|---|---|---|---|---|---|
| 2008 | 14,448 | 8,816 | 8,710 | 13,175 | 18,429 | 23,477 | 26,475 | 30,040 | 34,012 | 31,097 | 26,827 | 19,715 |
| 2009 | 15,929 | 14,124 | 14,388 | 18,044 | 24,574 | 30,382 | 37,539 | 41,645 | 41,923 | 36,884 | 29,154 | 21,461 |
| 2010 | 15,000 | 10,276 | 11,058 | 15,816 | 22,469 | 28,146 | 32,860 | 37,090 | 38,661 | 37,401 | 34,401 | 25,977 |
| 2011 | 17,434 | 10,100 | 9,365 | 14,075 | 20,318 | 26,928 | 33,453 | 38,942 | 40,680 | 40,231 | 36,898 | 30,702 |
| 2012 | 24,250 | 19,538 | 20,725 | 24,141 | 28,866 | 33,134 | 35,807 | 39,278 | 40,983 | 38,039 | 33,241 | 25,224 |
| 2013 | 18,171 | 14,341 | 13,279 | 16,056 | 21,016 | 26,093 | 30,666 | 37,300 | 39,518 | 34,465 | 28,431 | 19,945 |
| 2014 | 14,933 | 9,935 | 10,588 | 15,426 | 22,138 | 28,456 | 34,960 | 39,743 | 42,569 | 38,896 | 35,417 | 31,027 |
| 2015 | 24,777 | 18,990 | 19,468 | 25,420 | 29,039 | 33,831 | 38,212 | 41,246 | 42,170 | 40,829 | 38,613 | 32,620 |
| 2016 | 23,409 | 18,445 | 19,089 | 21,827 | 27,395 | 35,843 | 41,472 | 43,187 | 43,610 | 38,450 | 34,534 | 25,916 |
| 2017 | 18,187 | 15,974 | 14,160 | 16,701 | 21,300 | 27,312 | 33,331 | 39,424 | 41,661 | 41,933 | 36,528 | 28,235 |
| 2018 | 17,615 | 14,000 | 12,614 | 15,545 | 23,927 | 29,419 | 35,876 | 41,453 | 44,180 | 41,385 | 34,323 | 29,178 |
| 2019 | 22,218 | 16,971 | 15,352 | 18,687 | 25,495 | 31,554 | 36,864 | 41,405 | 43,266 | 37,495 | 30,984 | 25,648 |
| 2020 | 20,210 | 15,006 | 15,755 | 18,705 | 24,102 | 30,000 | 37,564 | 43,541 | 42,933 | 38,520 | 32,158 | 23,452 |
| 2021 | 18,479 | 11,676 | 12,960 | 14,148 | 18,121 | 23,702 | 27,890 | 34,994 | 37,268 | 36,012 | 32,366 | 26,941 |
| 2022 | 18,695 | 13,035 | 11,950 | 13,130 | 19,255 | 24,707 | 30,032 | 33,838 | 38,117 | 37,384 | 35,510 | 28,918 |
| 2023 | 23,876 | 17,250 | 14,556 | 17,441 | 23,589 | 28,023 | 34,069 | 39,759 | 41,346 | 38,714 | 33,199 | 26,881 |
| 2024 | 18,453 | |||||||||||
| - = No Data Reported; -- = Not Applicable; NA = Not Available; W = Withheld to avoid disclosure of individual company data. |
| Release Date: 3/29/2024 |
| Next Release Date: 4/30/2024 |