|
Download Data (XLS File) |
|
||||||||
|
||||||||
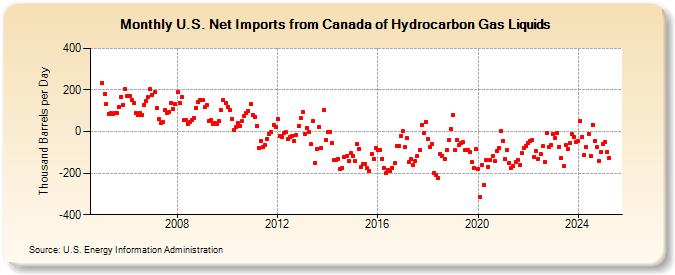
| U.S. Net Imports from Canada of Hydrocarbon Gas Liquids (Thousand Barrels per Day) | ||||||||
| Year | Jan | Feb | Mar | Apr | May | Jun | Jul | Aug | Sep | Oct | Nov | Dec |
|---|---|---|---|---|---|---|---|---|---|---|---|---|
| 2005 | 235 | 183 | 134 | 86 | 88 | 85 | 87 | 88 | 119 | 167 | 130 | 207 |
| 2006 | 172 | 169 | 151 | 137 | 91 | 79 | 89 | 82 | 129 | 147 | 167 | 203 |
| 2007 | 175 | 188 | 115 | 59 | 42 | 47 | 103 | 87 | 92 | 139 | 109 | 131 |
| 2008 | 189 | 137 | 168 | 54 | 55 | 38 | 44 | 56 | 67 | 113 | 141 | 151 |
| 2009 | 151 | 116 | 127 | 49 | 56 | 37 | 41 | 34 | 49 | 102 | 152 | 138 |
| 2010 | 117 | 105 | 58 | 7 | 20 | 39 | 28 | 49 | 74 | 87 | 99 | 134 |
| 2011 | 81 | 70 | 27 | -78 | -44 | -74 | -65 | -34 | -10 | -1 | 31 | 24 |
| 2012 | 58 | -19 | -26 | -7 | -2 | -38 | -27 | -19 | -46 | -15 | 27 | 66 |
| 2013 | 94 | -12 | 19 | -1 | -62 | 50 | -150 | -84 | 23 | -80 | 105 | -40 |
| 2014 | 0 | 0 | -55 | -139 | -138 | -134 | -182 | -175 | -122 | -119 | -141 | -105 |
| 2015 | -116 | -144 | -62 | -85 | -169 | -155 | -155 | -175 | -189 | -109 | -130 | -78 |
| 2016 | -88 | -88 | -130 | -174 | -200 | -187 | -191 | -173 | -153 | -69 | -70 | -20 |
| 2017 | 1 | -76 | -32 | -147 | -130 | -161 | -142 | -118 | -89 | 32 | -6 | 47 |
| 2018 | -34 | -72 | -62 | -199 | -207 | -223 | -107 | -116 | -134 | -90 | -41 | 11 |
| 2019 | 79 | -89 | -42 | -66 | -54 | -52 | -90 | -87 | -100 | -148 | -176 | -86 |
| 2020 | -181 | -313 | -160 | -255 | -136 | -169 | -139 | -119 | -142 | -94 | -80 | 5 |
| 2021 | -44 | -132 | -91 | -151 | -173 | -167 | -145 | -135 | -163 | -104 | -79 | -70 |
| 2022 | -53 | -44 | -41 | -122 | -94 | -130 | -108 | -71 | -145 | -9 | -73 | -64 |
| 2023 | -11 | -17 | -5 | -78 | -5 | -57 | 0 | 6 | 23 | 69 | -22 | -44 |
| 2024 | -46 | |||||||||||
| - = No Data Reported; -- = Not Applicable; NA = Not Available; W = Withheld to avoid disclosure of individual company data. |
| Release Date: 3/29/2024 |
| Next Release Date: 4/30/2024 |