|
Download Data (XLS File) |
|
||||||||
|
||||||||
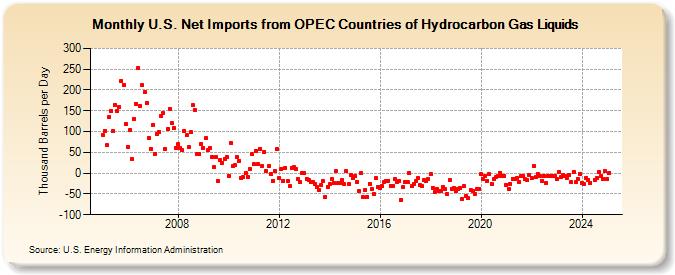
| U.S. Net Imports from OPEC Countries of Hydrocarbon Gas Liquids (Thousand Barrels per Day) | ||||||||
| Year | Jan | Feb | Mar | Apr | May | Jun | Jul | Aug | Sep | Oct | Nov | Dec |
|---|---|---|---|---|---|---|---|---|---|---|---|---|
| 2005 | 92 | 102 | 67 | 134 | 149 | 101 | 165 | 150 | 159 | 222 | 212 | 119 |
| 2006 | 63 | 103 | 34 | 131 | 167 | 253 | 161 | 211 | 195 | 169 | 85 | 59 |
| 2007 | 116 | 47 | 95 | 100 | 137 | 144 | 58 | 106 | 155 | 121 | 108 | 61 |
| 2008 | 69 | 60 | 55 | 102 | 91 | 63 | 98 | 163 | 152 | 45 | 46 | 71 |
| 2009 | 61 | 84 | 55 | 60 | 40 | 14 | 39 | -19 | 31 | 25 | 34 | 39 |
| 2010 | -6 | 73 | 17 | 19 | 38 | 30 | -11 | -9 | 0 | -9 | 9 | 46 |
| 2011 | 21 | 54 | 21 | 59 | 18 | 51 | 5 | 16 | -3 | -18 | 5 | 58 |
| 2012 | -12 | 11 | -18 | 13 | -20 | -32 | 13 | 14 | 10 | -14 | -22 | 0 |
| 2013 | 0 | -13 | -16 | -22 | -22 | -25 | -34 | -41 | -28 | -19 | -58 | -33 |
| 2014 | -27 | -14 | -23 | 4 | -24 | -23 | -16 | -27 | 4 | -27 | -4 | -12 |
| 2015 | -8 | -21 | -43 | 0 | -58 | -40 | -57 | -25 | -38 | -49 | -12 | -33 |
| 2016 | -35 | -31 | -22 | -19 | -18 | -30 | -30 | -14 | -21 | -18 | -64 | -33 |
| 2017 | -22 | -22 | 0 | -31 | -26 | -20 | -12 | -29 | -32 | -16 | -18 | -14 |
| 2018 | -3 | -35 | -45 | -38 | -44 | -43 | -33 | -39 | -50 | -17 | -37 | -36 |
| 2019 | -42 | -37 | -35 | -62 | -32 | -55 | -61 | -40 | -43 | -49 | -38 | -37 |
| 2020 | -3 | -13 | -7 | -18 | -3 | -26 | -15 | -10 | -7 | 1 | -6 | -6 |
| 2021 | -28 | -37 | -26 | -13 | -15 | -11 | -21 | -8 | -7 | -15 | -17 | -5 |
| 2022 | -12 | 18 | -10 | -2 | -6 | -18 | -6 | -23 | -8 | -8 | -6 | -8 |
| 2023 | -15 | 3 | -10 | -5 | -7 | -11 | -15 | -15 | 3 | -22 | -14 | -1 |
| 2024 | -23 | |||||||||||
| - = No Data Reported; -- = Not Applicable; NA = Not Available; W = Withheld to avoid disclosure of individual company data. |
| Release Date: 3/29/2024 |
| Next Release Date: 4/30/2024 |