|
Download Data (XLS File) |
|
||||||||
|
||||||||
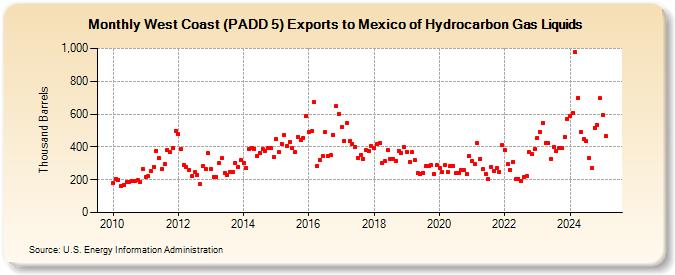
| West Coast (PADD 5) Exports to Mexico of Hydrocarbon Gas Liquids (Thousand Barrels) | ||||||||
| Year | Jan | Feb | Mar | Apr | May | Jun | Jul | Aug | Sep | Oct | Nov | Dec |
|---|---|---|---|---|---|---|---|---|---|---|---|---|
| 2010 | 180 | 202 | 201 | 159 | 170 | 184 | 188 | 195 | 190 | 198 | 188 | 267 |
| 2011 | 218 | 221 | 252 | 279 | 377 | 332 | 268 | 295 | 384 | 366 | 391 | 498 |
| 2012 | 478 | 387 | 288 | 279 | 261 | 221 | 246 | 231 | 173 | 282 | 267 | 362 |
| 2013 | 263 | 219 | 216 | 302 | 330 | 241 | 228 | 245 | 247 | 304 | 278 | 320 |
| 2014 | 299 | 271 | 388 | 394 | 389 | 346 | 363 | 386 | 377 | 393 | 391 | 336 |
| 2015 | 448 | 368 | 420 | 470 | 404 | 431 | 391 | 369 | 463 | 441 | 455 | 586 |
| 2016 | 492 | 494 | 672 | 282 | 319 | 343 | 490 | 344 | 349 | 475 | 649 | 599 |
| 2017 | 520 | 436 | 547 | 434 | 420 | 401 | 333 | 351 | 328 | 379 | 372 | 404 |
| 2018 | 395 | 418 | 423 | 301 | 312 | 379 | 324 | 327 | 317 | 378 | 361 | 399 |
| 2019 | 369 | 309 | 367 | 319 | 242 | 233 | 244 | 282 | 281 | 289 | 234 | 288 |
| 2020 | 269 | 245 | 288 | 248 | 282 | 282 | 238 | 244 | 262 | 257 | 234 | 343 |
| 2021 | 317 | 293 | 421 | 328 | 265 | 236 | 203 | 277 | 254 | 272 | 249 | 410 |
| 2022 | 383 | 294 | 261 | 309 | 202 | 207 | 195 | 214 | 221 | 366 | 356 | 388 |
| 2023 | 453 | 492 | 553 | 419 | 423 | 328 | 398 | 374 | 393 | 394 | 459 | 570 |
| 2024 | 590 | |||||||||||
| - = No Data Reported; -- = Not Applicable; NA = Not Available; W = Withheld to avoid disclosure of individual company data. |
| Release Date: 3/29/2024 |
| Next Release Date: 4/30/2024 |