|
Download Data (XLS File) |
|
||||||||
|
||||||||
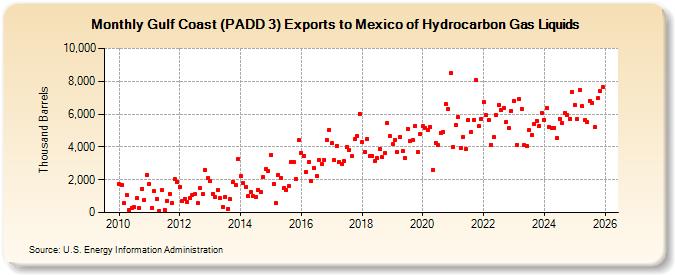
| Gulf Coast (PADD 3) Exports to Mexico of Hydrocarbon Gas Liquids (Thousand Barrels) | ||||||||
| Year | Jan | Feb | Mar | Apr | May | Jun | Jul | Aug | Sep | Oct | Nov | Dec |
|---|---|---|---|---|---|---|---|---|---|---|---|---|
| 2010 | 1,711 | 1,660 | 563 | 1,079 | 148 | 302 | 323 | 869 | 284 | 1,454 | 791 | 2,277 |
| 2011 | 1,732 | 304 | 1,310 | 841 | 111 | 1,366 | 172 | 733 | 1,132 | 579 | 2,019 | 1,884 |
| 2012 | 1,559 | 718 | 828 | 632 | 859 | 1,099 | 1,116 | 568 | 1,466 | 1,107 | 2,610 | 2,080 |
| 2013 | 1,922 | 1,156 | 951 | 1,385 | 859 | 349 | 945 | 234 | 823 | 1,851 | 1,673 | 3,242 |
| 2014 | 2,218 | 1,792 | 1,581 | 1,005 | 1,236 | 993 | 970 | 1,400 | 1,248 | 2,161 | 2,663 | 2,546 |
| 2015 | 3,524 | 1,769 | 567 | 2,300 | 2,131 | 1,495 | 1,396 | 1,613 | 3,054 | 3,091 | 2,033 | 4,397 |
| 2016 | 3,655 | 3,474 | 2,466 | 3,106 | 1,935 | 2,734 | 2,241 | 3,205 | 2,970 | 3,213 | 4,434 | 5,041 |
| 2017 | 4,207 | 3,200 | 4,068 | 3,067 | 2,956 | 3,117 | 3,971 | 3,825 | 3,428 | 4,468 | 4,675 | 6,030 |
| 2018 | 4,293 | 3,710 | 4,492 | 3,431 | 3,416 | 3,138 | 3,337 | 3,858 | 3,368 | 3,602 | 5,458 | 4,645 |
| 2019 | 4,176 | 4,450 | 3,671 | 4,609 | 3,744 | 3,345 | 5,111 | 4,385 | 4,407 | 5,296 | 3,699 | 4,758 |
| 2020 | 5,251 | 5,162 | 5,005 | 5,223 | 2,620 | 4,222 | 4,089 | 4,852 | 4,910 | 6,612 | 6,336 | 8,473 |
| 2021 | 4,010 | 5,332 | 5,814 | 3,957 | 4,603 | 3,875 | 5,646 | 4,896 | 5,638 | 8,055 | 5,243 | 5,725 |
| 2022 | 6,757 | 5,913 | 5,622 | 4,132 | 4,580 | 5,925 | 6,552 | 6,238 | 6,383 | 5,539 | 5,123 | 6,200 |
| 2023 | 6,537 | 4,284 | 7,259 | 5,629 | 4,085 | 4,031 | 5,061 | 4,712 | 5,376 | 5,570 | 5,291 | 6,077 |
| 2024 | 5,647 | 5,565 | 4,896 | 5,161 | ||||||||
| - = No Data Reported; -- = Not Applicable; NA = Not Available; W = Withheld to avoid disclosure of individual company data. |
| Release Date: 6/28/2024 |
| Next Release Date: 7/31/2024 |