|
Download Data (XLS File) |
|
||||||||
|
||||||||
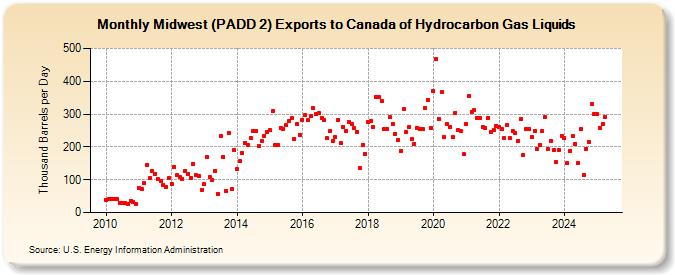
| Midwest (PADD 2) Exports to Canada of Hydrocarbon Gas Liquids (Thousand Barrels per Day) | ||||||||
| Year | Jan | Feb | Mar | Apr | May | Jun | Jul | Aug | Sep | Oct | Nov | Dec |
|---|---|---|---|---|---|---|---|---|---|---|---|---|
| 2010 | 39 | 40 | 40 | 42 | 42 | 30 | 28 | 29 | 25 | 36 | 32 | 25 |
| 2011 | 74 | 73 | 89 | 145 | 104 | 126 | 118 | 102 | 95 | 84 | 78 | 104 |
| 2012 | 87 | 138 | 114 | 107 | 102 | 127 | 116 | 106 | 148 | 113 | 111 | 69 |
| 2013 | 86 | 168 | 109 | 100 | 127 | 58 | 233 | 170 | 65 | 243 | 71 | 190 |
| 2014 | 133 | 157 | 181 | 213 | 207 | 228 | 248 | 247 | 203 | 218 | 234 | 245 |
| 2015 | 250 | 309 | 206 | 206 | 259 | 255 | 266 | 278 | 288 | 225 | 269 | 237 |
| 2016 | 283 | 297 | 282 | 293 | 317 | 300 | 302 | 289 | 281 | 226 | 247 | 217 |
| 2017 | 230 | 283 | 211 | 261 | 248 | 277 | 271 | 259 | 245 | 137 | 207 | 179 |
| 2018 | 277 | 278 | 260 | 352 | 352 | 340 | 253 | 256 | 290 | 270 | 239 | 221 |
| 2019 | 188 | 316 | 246 | 260 | 224 | 210 | 259 | 256 | 256 | 318 | 344 | 259 |
| 2020 | 369 | 468 | 286 | 368 | 230 | 271 | 261 | 230 | 304 | 251 | 247 | 178 |
| 2021 | 271 | 356 | 307 | 311 | 288 | 288 | 260 | 257 | 289 | 246 | 252 | 264 |
| 2022 | 261 | 254 | 226 | 266 | 226 | 248 | 242 | 218 | 285 | 176 | 255 | 255 |
| 2023 | 225 | 233 | 194 | 208 | 128 | 182 | 127 | 126 | 110 | 78 | 190 | 229 |
| 2024 | 228 | 150 | 188 | 232 | ||||||||
| - = No Data Reported; -- = Not Applicable; NA = Not Available; W = Withheld to avoid disclosure of individual company data. |
| Release Date: 6/28/2024 |
| Next Release Date: 7/31/2024 |