|
Download Data (XLS File) |
|
||||||||
|
||||||||
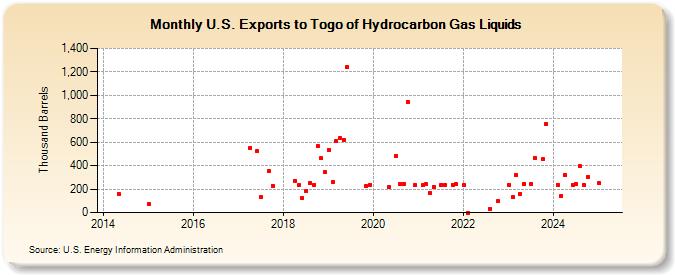
| U.S. Exports to Togo of Hydrocarbon Gas Liquids (Thousand Barrels) | ||||||||
| Year | Jan | Feb | Mar | Apr | May | Jun | Jul | Aug | Sep | Oct | Nov | Dec |
|---|---|---|---|---|---|---|---|---|---|---|---|---|
| 2014 | 160 | |||||||||||
| 2015 | 70 | |||||||||||
| 2017 | 554 | 522 | 129 | 357 | 230 | |||||||
| 2018 | 271 | 234 | 125 | 181 | 250 | 238 | 568 | 463 | 342 | |||
| 2019 | 536 | 257 | 608 | 635 | 622 | 1,240 | 230 | 238 | ||||
| 2020 | 216 | 482 | 245 | 243 | 947 | 237 | ||||||
| 2021 | 235 | 241 | 167 | 222 | 239 | 239 | 236 | 243 | ||||
| 2022 | 238 | 0 | 34 | 96 | ||||||||
| 2023 | 239 | 130 | 59 | 107 | 244 | 246 | 468 | 456 | 758 | |||
| - = No Data Reported; -- = Not Applicable; NA = Not Available; W = Withheld to avoid disclosure of individual company data. |
| Release Date: 3/29/2024 |
| Next Release Date: 4/30/2024 |