|
Download Data (XLS File) |
|
||||||||
|
||||||||
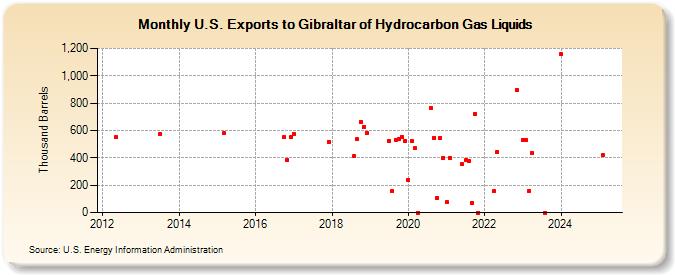
| U.S. Exports to Gibraltar of Hydrocarbon Gas Liquids (Thousand Barrels) | ||||||||
| Year | Jan | Feb | Mar | Apr | May | Jun | Jul | Aug | Sep | Oct | Nov | Dec |
|---|---|---|---|---|---|---|---|---|---|---|---|---|
| 2012 | 550 | |||||||||||
| 2013 | 575 | |||||||||||
| 2015 | 578 | |||||||||||
| 2016 | 550 | 386 | 550 | |||||||||
| 2017 | 577 | 519 | ||||||||||
| 2018 | 411 | 535 | 663 | 629 | 578 | |||||||
| 2019 | 525 | 155 | 534 | 539 | 555 | 524 | ||||||
| 2020 | 238 | 525 | 469 | 0 | 766 | 548 | 109 | 548 | 401 | |||
| 2021 | 75 | 399 | 352 | 383 | 376 | 69 | 719 | 0 | ||||
| 2022 | 156 | 444 | 899 | |||||||||
| 2023 | 528 | 529 | 158 | 276 | 581 | |||||||
| 2024 | 1,158 | |||||||||||
| - = No Data Reported; -- = Not Applicable; NA = Not Available; W = Withheld to avoid disclosure of individual company data. |
| Release Date: 3/29/2024 |
| Next Release Date: 4/30/2024 |