|
Download Data (XLS File) |
|
||||||||
|
||||||||
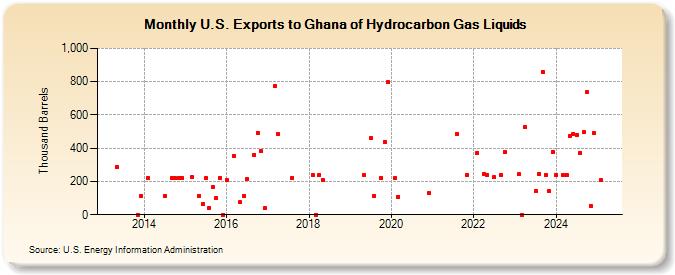
| U.S. Exports to Ghana of Hydrocarbon Gas Liquids (Thousand Barrels) | ||||||||
| Year | Jan | Feb | Mar | Apr | May | Jun | Jul | Aug | Sep | Oct | Nov | Dec |
|---|---|---|---|---|---|---|---|---|---|---|---|---|
| 2013 | 286 | 0 | 114 | |||||||||
| 2014 | 222 | 114 | 221 | 222 | 222 | 223 | ||||||
| 2015 | 224 | 114 | 64 | 222 | 42 | 168 | 103 | 221 | 0 | |||
| 2016 | 209 | 354 | 74 | 112 | 215 | 361 | 492 | 382 | 40 | |||
| 2017 | 772 | 486 | 222 | |||||||||
| 2018 | 240 | 0 | 241 | 211 | ||||||||
| 2019 | 240 | 460 | 114 | 220 | 439 | 796 | ||||||
| 2020 | 220 | 109 | 130 | |||||||||
| 2021 | 486 | 240 | ||||||||||
| 2022 | 374 | 246 | 239 | 224 | 240 | 379 | ||||||
| 2023 | 242 | 0 | 451 | 142 | 244 | 860 | 240 | 140 | 379 | |||
| 2024 | 239 | |||||||||||
| - = No Data Reported; -- = Not Applicable; NA = Not Available; W = Withheld to avoid disclosure of individual company data. |
| Release Date: 3/29/2024 |
| Next Release Date: 4/30/2024 |