|
Download Data (XLS File) |
|
||||||||
|
||||||||
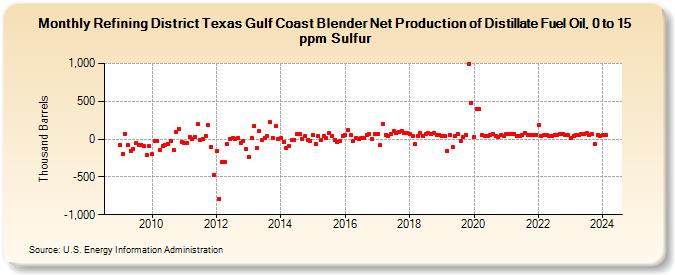
| Refining District Texas Gulf Coast Blender Net Production of Distillate Fuel Oil, 0 to 15 ppm Sulfur (Thousand Barrels) | ||||||||
| Year | Jan | Feb | Mar | Apr | May | Jun | Jul | Aug | Sep | Oct | Nov | Dec |
|---|---|---|---|---|---|---|---|---|---|---|---|---|
| 2009 | -79 | -192 | 69 | -75 | -152 | -130 | -52 | -80 | -75 | -96 | -210 | -88 |
| 2010 | -202 | -22 | -27 | -141 | -91 | -74 | -61 | -20 | -143 | 98 | 138 | -33 |
| 2011 | -47 | -57 | 30 | 1 | 22 | 196 | -12 | -1 | 40 | 182 | -104 | -477 |
| 2012 | -160 | -792 | -305 | -303 | -67 | 7 | 12 | 3 | 15 | -53 | -30 | -128 |
| 2013 | -235 | 11 | 172 | -112 | 105 | -9 | 16 | 37 | 226 | 19 | 168 | 1 |
| 2014 | 11 | -33 | -115 | -93 | -14 | -7 | 65 | 69 | 7 | 37 | -11 | -20 |
| 2015 | 58 | -69 | 44 | -16 | 36 | 11 | 76 | 46 | -9 | -37 | -30 | 36 |
| 2016 | 48 | 116 | 54 | -20 | 10 | 2 | 13 | 18 | 56 | 67 | -1 | 65 |
| 2017 | 61 | -82 | 202 | 50 | 40 | 69 | 104 | 78 | 94 | 108 | 86 | 81 |
| 2018 | 68 | 43 | -71 | 43 | 80 | 37 | 68 | 75 | 64 | 75 | 51 | 55 |
| 2019 | 43 | 40 | -151 | 51 | -105 | 39 | 67 | -20 | 28 | 56 | 990 | 480 |
| 2020 | 26 | 402 | 397 | 54 | 40 | 47 | 53 | 62 | 38 | 22 | 58 | 44 |
| 2021 | 61 | 68 | 63 | 64 | 39 | 46 | 50 | 87 | 49 | 56 | 56 | 60 |
| 2022 | 182 | 36 | 48 | 53 | 45 | 47 | 56 | 56 | 61 | 65 | 52 | 50 |
| 2023 | 22 | 55 | 71 | -73 | -57 | -87 | 78 | -67 | -95 | -186 | -53 | 53 |
| 2024 | 55 | 55 | 61 | 69 | 63 | 65 | ||||||
| - = No Data Reported; -- = Not Applicable; NA = Not Available; W = Withheld to avoid disclosure of individual company data. |
| Release Date: 8/30/2024 |
| Next Release Date: 9/30/2024 |