|
Download Data (XLS File) |
|
||||||||
|
||||||||
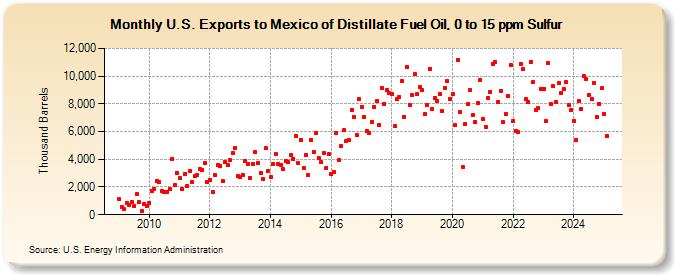
| U.S. Exports to Mexico of Distillate Fuel Oil, 0 to 15 ppm Sulfur (Thousand Barrels) | ||||||||
| Year | Jan | Feb | Mar | Apr | May | Jun | Jul | Aug | Sep | Oct | Nov | Dec |
|---|---|---|---|---|---|---|---|---|---|---|---|---|
| 2009 | 1,122 | 592 | 416 | 873 | 671 | 931 | 607 | 1,474 | 906 | 241 | 803 | 661 |
| 2010 | 853 | 1,716 | 1,822 | 2,452 | 2,354 | 1,711 | 1,625 | 1,660 | 1,881 | 4,013 | 2,137 | 3,040 |
| 2011 | 2,646 | 1,839 | 2,929 | 2,049 | 3,141 | 2,381 | 2,788 | 2,891 | 3,333 | 3,256 | 3,754 | 2,395 |
| 2012 | 2,518 | 1,661 | 2,888 | 3,568 | 3,525 | 2,449 | 3,805 | 3,575 | 3,934 | 4,480 | 4,834 | 2,829 |
| 2013 | 2,702 | 2,874 | 3,861 | 3,630 | 2,651 | 3,664 | 4,517 | 3,720 | 3,027 | 2,600 | 4,798 | 3,179 |
| 2014 | 2,742 | 3,653 | 4,355 | 3,660 | 3,589 | 3,264 | 3,902 | 3,784 | 4,279 | 4,018 | 5,646 | 3,705 |
| 2015 | 5,358 | 3,368 | 4,295 | 2,837 | 5,408 | 4,535 | 5,886 | 4,114 | 3,777 | 4,459 | 3,405 | 4,369 |
| 2016 | 2,905 | 3,051 | 5,905 | 3,933 | 4,952 | 6,083 | 5,288 | 5,399 | 7,571 | 7,049 | 5,729 | 8,319 |
| 2017 | 7,791 | 7,077 | 6,028 | 5,899 | 6,705 | 7,804 | 8,189 | 6,496 | 9,174 | 8,014 | 9,018 | 8,807 |
| 2018 | 8,704 | 6,368 | 8,326 | 8,501 | 9,642 | 7,074 | 10,645 | 7,928 | 8,634 | 10,144 | 8,685 | 9,242 |
| 2019 | 8,975 | 7,262 | 7,883 | 10,536 | 7,594 | 8,451 | 8,239 | 8,713 | 7,490 | 9,172 | 9,662 | 8,378 |
| 2020 | 8,704 | 6,498 | 11,165 | 7,423 | 3,456 | 6,543 | 7,963 | 8,991 | 7,160 | 6,724 | 8,026 | 9,712 |
| 2021 | 6,924 | 6,356 | 8,408 | 8,839 | 10,859 | 10,994 | 8,148 | 8,946 | 6,668 | 7,275 | 8,570 | 10,836 |
| 2022 | 6,769 | 6,042 | 5,943 | 10,880 | 10,484 | 8,314 | 8,136 | 11,035 | 9,607 | 7,560 | 7,702 | 9,088 |
| 2023 | 9,376 | 6,842 | 11,489 | 8,143 | 9,171 | 8,120 | 10,004 | 8,302 | 9,173 | 9,531 | 7,693 | 7,581 |
| 2024 | 6,795 | 5,414 | 8,235 | 7,622 | ||||||||
| - = No Data Reported; -- = Not Applicable; NA = Not Available; W = Withheld to avoid disclosure of individual company data. |
| Release Date: 6/28/2024 |
| Next Release Date: 7/31/2024 |