|
Download Data (XLS File) |
|
||||||||
|
||||||||
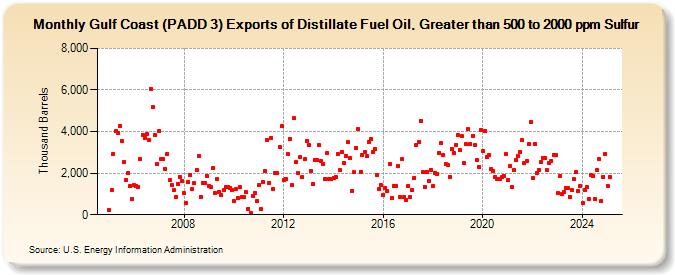
| Gulf Coast (PADD 3) Exports of Distillate Fuel Oil, Greater than 500 to 2000 ppm Sulfur (Thousand Barrels) | ||||||||
| Year | Jan | Feb | Mar | Apr | May | Jun | Jul | Aug | Sep | Oct | Nov | Dec |
|---|---|---|---|---|---|---|---|---|---|---|---|---|
| 2005 | 248 | 1,197 | 2,941 | 4,006 | 3,943 | 4,274 | 3,537 | 2,530 | 1,677 | 1,983 | 1,401 | 776 |
| 2006 | 1,423 | 1,398 | 1,321 | 2,674 | 3,856 | 3,694 | 3,867 | 3,608 | 6,058 | 5,170 | 3,852 | 2,454 |
| 2007 | 4,004 | 2,673 | 2,669 | 2,214 | 2,943 | 1,653 | 1,445 | 1,168 | 855 | 1,498 | 1,834 | 1,632 |
| 2008 | 1,031 | 582 | 1,565 | 1,906 | 1,223 | 1,505 | 2,169 | 2,831 | 875 | 1,537 | 1,504 | 1,863 |
| 2009 | 1,397 | 1,323 | 2,239 | 1,037 | 1,721 | 1,110 | 942 | 1,176 | 1,315 | 1,310 | 1,270 | 1,201 |
| 2010 | 658 | 1,236 | 782 | 1,347 | 869 | 834 | 1,075 | 287 | 102 | 897 | 1,066 | 645 |
| 2011 | 1,413 | 259 | 1,590 | 2,085 | 3,607 | 1,536 | 3,698 | 1,239 | 1,989 | 2,014 | 3,254 | 4,255 |
| 2012 | 1,671 | 1,710 | 2,920 | 3,663 | 1,435 | 4,642 | 2,533 | 1,999 | 2,753 | 1,831 | 2,656 | 3,545 |
| 2013 | 3,357 | 2,120 | 1,479 | 2,610 | 2,620 | 3,343 | 2,577 | 2,456 | 1,729 | 2,954 | 1,700 | 1,714 |
| 2014 | 1,772 | 1,831 | 2,923 | 2,128 | 3,034 | 2,498 | 2,848 | 3,484 | 2,706 | 1,155 | 2,031 | 3,230 |
| 2015 | 4,127 | 2,070 | 2,858 | 3,021 | 2,803 | 3,504 | 3,646 | 3,013 | 3,138 | 1,930 | 1,216 | 1,453 |
| 2016 | 966 | 1,300 | 1,138 | 2,454 | 802 | 1,395 | 1,376 | 2,359 | 861 | 2,662 | 843 | 714 |
| 2017 | 1,393 | 834 | 1,179 | 1,789 | 3,360 | 3,498 | 4,527 | 2,050 | 1,345 | 2,067 | 1,606 | 2,145 |
| 2018 | 1,384 | 2,029 | 1,971 | 2,983 | 3,441 | 2,876 | 2,426 | 2,399 | 1,830 | 3,152 | 2,966 | 3,368 |
| 2019 | 3,824 | 3,106 | 3,767 | 2,472 | 3,386 | 4,120 | 3,399 | 3,800 | 3,334 | 2,634 | 2,311 | 4,098 |
| 2020 | 3,060 | 4,025 | 2,789 | 2,872 | 2,175 | 2,111 | 1,809 | 1,738 | 1,738 | 1,794 | 1,880 | 2,921 |
| 2021 | 1,674 | 2,338 | 1,318 | 2,174 | 2,635 | 2,802 | 3,033 | 3,572 | 2,495 | 2,569 | 3,396 | 4,436 |
| 2022 | 1,745 | 3,419 | 2,005 | 2,163 | 2,537 | 2,749 | 2,731 | 2,133 | 2,481 | 2,594 | 2,891 | 2,879 |
| 2023 | 1,481 | 1,516 | 1,364 | 1,412 | 1,358 | 1,554 | 1,469 | 1,355 | 2,003 | 2,061 | 1,131 | 1,375 |
| 2024 | 573 | |||||||||||
| - = No Data Reported; -- = Not Applicable; NA = Not Available; W = Withheld to avoid disclosure of individual company data. |
| Release Date: 3/29/2024 |
| Next Release Date: 4/30/2024 |