|
Download Data (XLS File) |
|
||||||||
|
||||||||
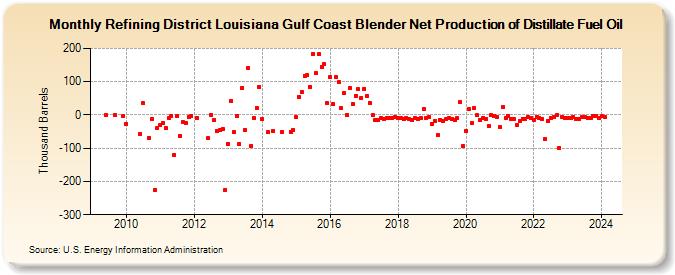
| Refining District Louisiana Gulf Coast Blender Net Production of Distillate Fuel Oil (Thousand Barrels) | ||||||||
| Year | Jan | Feb | Mar | Apr | May | Jun | Jul | Aug | Sep | Oct | Nov | Dec |
|---|---|---|---|---|---|---|---|---|---|---|---|---|
| 2009 | -1 | 0 | -2 | |||||||||
| 2010 | -26 | -56 | 35 | -68 | -12 | -225 | -40 | |||||
| 2011 | -30 | -25 | -40 | -9 | -3 | -120 | -4 | -62 | -22 | -23 | -5 | -2 |
| 2012 | -8 | -70 | 1 | -15 | -47 | -46 | -41 | -225 | ||||
| 2013 | -86 | 42 | -52 | -2 | -87 | 82 | -45 | 141 | -93 | -8 | 21 | 85 |
| 2014 | -13 | -52 | -48 | -50 | -50 | -46 | ||||||
| 2015 | -7 | 55 | 70 | 118 | 120 | 85 | 184 | 126 | 183 | 144 | 152 | 35 |
| 2016 | 114 | 33 | 113 | 98 | 20 | 67 | 1 | 81 | 33 | 58 | 77 | 51 |
| 2017 | 79 | 58 | 37 | -1 | -16 | -14 | -8 | -12 | -8 | -10 | -8 | -6 |
| 2018 | -10 | -9 | -13 | -8 | -13 | -14 | -10 | -12 | -10 | 18 | -9 | -6 |
| 2019 | -26 | -18 | -60 | -14 | -17 | -13 | -10 | -12 | -15 | -10 | 38 | -93 |
| 2020 | -47 | 17 | -23 | 20 | -1 | -14 | -8 | -11 | -32 | 0 | -3 | -7 |
| 2021 | -36 | 24 | -8 | -3 | -12 | -13 | -29 | -17 | -12 | -11 | -7 | -8 |
| 2022 | -15 | -7 | -9 | -12 | -72 | -17 | -8 | -6 | -1 | -100 | -6 | -8 |
| 2023 | -9 | -8 | -5 | -13 | -13 | -7 | -6 | -8 | -8 | -2 | -3 | -9 |
| 2024 | -4 | |||||||||||
| - = No Data Reported; -- = Not Applicable; NA = Not Available; W = Withheld to avoid disclosure of individual company data. |
| Release Date: 3/29/2024 |
| Next Release Date: 4/30/2024 |