|
Download Data (XLS File) |
|
||||||||
|
||||||||
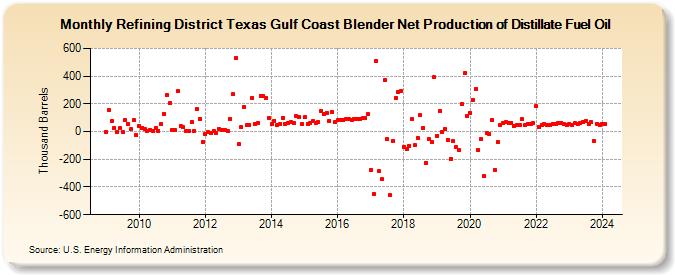
| Refining District Texas Gulf Coast Blender Net Production of Distillate Fuel Oil (Thousand Barrels) | ||||||||
| Year | Jan | Feb | Mar | Apr | May | Jun | Jul | Aug | Sep | Oct | Nov | Dec |
|---|---|---|---|---|---|---|---|---|---|---|---|---|
| 2009 | -1 | 153 | 75 | 24 | -1 | 24 | 0 | 84 | 55 | 15 | 81 | -27 |
| 2010 | 39 | 29 | 15 | 7 | 12 | 6 | 26 | 7 | 52 | 125 | 262 | 203 |
| 2011 | 9 | 9 | 292 | 41 | 31 | 7 | 6 | 68 | 6 | 162 | 92 | -76 |
| 2012 | -17 | -2 | -7 | 4 | -10 | 20 | 13 | 10 | 7 | 94 | 269 | 533 |
| 2013 | -93 | 31 | 178 | 44 | 49 | 243 | 54 | 62 | 259 | 256 | 241 | 101 |
| 2014 | 52 | 79 | 45 | 53 | 100 | 54 | 63 | 66 | 63 | 109 | 106 | 56 |
| 2015 | 103 | 53 | 61 | 73 | 61 | 70 | 151 | 129 | 134 | 77 | 141 | 68 |
| 2016 | 81 | 85 | 84 | 88 | 87 | 83 | 92 | 89 | 93 | 97 | 97 | 126 |
| 2017 | -276 | -448 | 512 | -288 | -345 | 370 | -56 | -459 | -69 | 242 | 285 | 296 |
| 2018 | -108 | -123 | -101 | 88 | -99 | -45 | 116 | 28 | -225 | -54 | -78 | 391 |
| 2019 | -29 | 145 | -1 | 16 | -59 | -196 | -70 | -115 | -136 | 199 | 421 | 113 |
| 2020 | 134 | 228 | 310 | -133 | -54 | -321 | -12 | -18 | 84 | -276 | -77 | 45 |
| 2021 | 61 | 68 | 63 | 64 | 39 | 46 | 50 | 87 | 49 | 56 | 56 | 60 |
| 2022 | 182 | 36 | 48 | 53 | 45 | 47 | 56 | 56 | 61 | 65 | 52 | 50 |
| 2023 | 56 | 45 | 59 | 54 | 61 | 69 | 77 | 51 | 67 | -67 | 55 | 46 |
| 2024 | 55 | |||||||||||
| - = No Data Reported; -- = Not Applicable; NA = Not Available; W = Withheld to avoid disclosure of individual company data. |
| Release Date: 3/29/2024 |
| Next Release Date: 4/30/2024 |