|
Download Data (XLS File) |
|
||||||||
|
||||||||
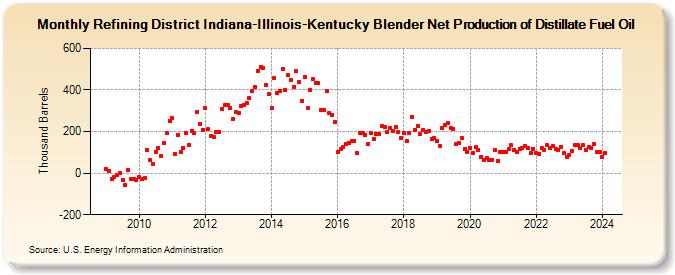
| Refining District Indiana-Illinois-Kentucky Blender Net Production of Distillate Fuel Oil (Thousand Barrels) | ||||||||
| Year | Jan | Feb | Mar | Apr | May | Jun | Jul | Aug | Sep | Oct | Nov | Dec |
|---|---|---|---|---|---|---|---|---|---|---|---|---|
| 2009 | 21 | 12 | -30 | -18 | -8 | 3 | -32 | -58 | 17 | -28 | -27 | -31 |
| 2010 | -21 | -28 | -24 | 110 | 61 | 46 | 104 | 120 | 83 | 144 | 192 | 252 |
| 2011 | 264 | 93 | 184 | 104 | 123 | 195 | 137 | 204 | 192 | 296 | 238 | 208 |
| 2012 | 312 | 211 | 180 | 172 | 198 | 200 | 309 | 326 | 329 | 315 | 260 | 294 |
| 2013 | 291 | 321 | 329 | 336 | 363 | 395 | 415 | 491 | 509 | 506 | 422 | 381 |
| 2014 | 314 | 456 | 387 | 397 | 502 | 401 | 471 | 449 | 415 | 489 | 436 | 349 |
| 2015 | 463 | 313 | 400 | 452 | 432 | 433 | 304 | 306 | 396 | 289 | 281 | 245 |
| 2016 | 100 | 117 | 125 | 138 | 145 | 153 | 156 | 96 | 193 | 193 | 185 | 142 |
| 2017 | 195 | 166 | 189 | 186 | 226 | 224 | 196 | 215 | 204 | 224 | 198 | 168 |
| 2018 | 191 | 156 | 191 | 272 | 208 | 227 | 187 | 209 | 200 | 205 | 162 | 170 |
| 2019 | 154 | 131 | 217 | 231 | 241 | 218 | 212 | 138 | 146 | 167 | 116 | 103 |
| 2020 | 120 | 98 | 124 | 113 | 78 | 61 | 74 | 63 | 64 | 111 | 59 | 100 |
| 2021 | 102 | 101 | 116 | 135 | 109 | 103 | 117 | 123 | 130 | 119 | 95 | 117 |
| 2022 | 96 | 91 | 120 | 113 | 133 | 121 | 130 | 115 | 111 | 127 | 95 | 80 |
| 2023 | 88 | 107 | 133 | 135 | 119 | 134 | 113 | 124 | 121 | 140 | 103 | 101 |
| 2024 | 80 | 96 | 109 | 52 | 113 | 165 | ||||||
| - = No Data Reported; -- = Not Applicable; NA = Not Available; W = Withheld to avoid disclosure of individual company data. |
| Release Date: 8/30/2024 |
| Next Release Date: 9/30/2024 |