|
Download Data (XLS File) |
|
||||||||
|
||||||||
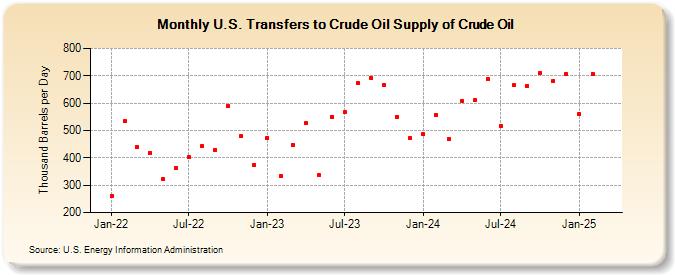
| U.S. Transfers to Crude Oil Supply of Crude Oil (Thousand Barrels per Day) | ||||||||
| Year | Jan | Feb | Mar | Apr | May | Jun | Jul | Aug | Sep | Oct | Nov | Dec |
|---|---|---|---|---|---|---|---|---|---|---|---|---|
| 2022 | 260 | 534 | 440 | 419 | 323 | 362 | 402 | 443 | 429 | 589 | 478 | 374 |
| 2023 | 448 | 295 | 422 | 462 | 431 | 634 | 617 | 758 | 725 | 735 | 534 | 474 |
| 2024 | 486 | 558 | ||||||||||
| - = No Data Reported; -- = Not Applicable; NA = Not Available; W = Withheld to avoid disclosure of individual company data. |
| Release Date: 4/30/2024 |
| Next Release Date: 5/31/2024 |
Referring Pages: