|
Download Data (XLS File) |
|
||||||||
|
||||||||
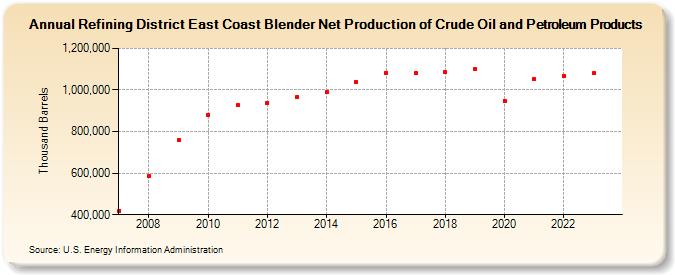
| Refining District East Coast Blender Net Production of Crude Oil and Petroleum Products (Thousand Barrels) | ||||||||
| Decade | Year-0 | Year-1 | Year-2 | Year-3 | Year-4 | Year-5 | Year-6 | Year-7 | Year-8 | Year-9 |
|---|---|---|---|---|---|---|---|---|---|---|
| 2000's | 420,199 | 585,797 | 758,895 | |||||||
| 2010's | 879,631 | 925,348 | 939,556 | 964,859 | 990,577 | 1,037,567 | 1,083,997 | 1,082,088 | 1,084,409 | 1,099,435 |
| 2020's | 947,210 | 1,050,645 | 1,068,207 | 1,079,293 |
| - = No Data Reported; -- = Not Applicable; NA = Not Available; W = Withheld to avoid disclosure of individual company data. |
| Release Date: 3/29/2024 |
| Next Release Date: 8/30/2024 |