|
Download Data (XLS File) |
|
||||||||
|
||||||||
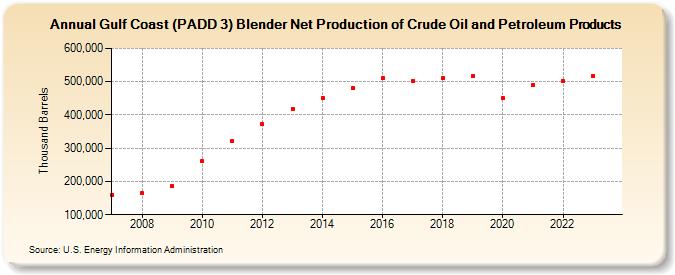
| Gulf Coast (PADD 3) Blender Net Production of Crude Oil and Petroleum Products (Thousand Barrels) | ||||||||
| Decade | Year-0 | Year-1 | Year-2 | Year-3 | Year-4 | Year-5 | Year-6 | Year-7 | Year-8 | Year-9 |
|---|---|---|---|---|---|---|---|---|---|---|
| 2000's | 159,620 | 163,888 | 187,182 | |||||||
| 2010's | 261,056 | 320,946 | 372,369 | 418,078 | 451,363 | 479,577 | 509,557 | 501,937 | 510,900 | 516,495 |
| 2020's | 450,362 | 490,462 | 501,669 | 515,989 |
| - = No Data Reported; -- = Not Applicable; NA = Not Available; W = Withheld to avoid disclosure of individual company data. |
| Release Date: 8/30/2024 |
| Next Release Date: 8/29/2025 |