|
Download Data (XLS File) |
|
||||||||
|
||||||||
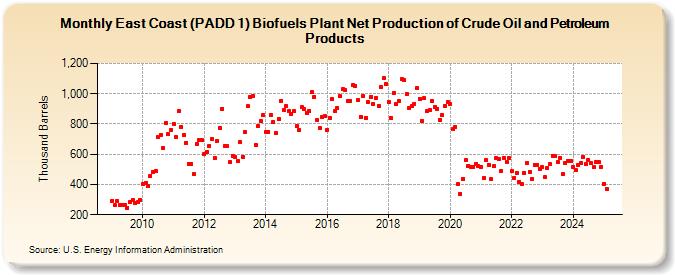
| East Coast (PADD 1) Biofuels Plant Net Production of Crude Oil and Petroleum Products (Thousand Barrels) | ||||||||
| Year | Jan | Feb | Mar | Apr | May | Jun | Jul | Aug | Sep | Oct | Nov | Dec |
|---|---|---|---|---|---|---|---|---|---|---|---|---|
| 2009 | 293 | 261 | 293 | 264 | 265 | 266 | 245 | 285 | 298 | 276 | 283 | 299 |
| 2010 | 400 | 411 | 390 | 458 | 484 | 490 | 711 | 730 | 642 | 807 | 732 | 761 |
| 2011 | 801 | 711 | 884 | 783 | 728 | 676 | 537 | 535 | 468 | 668 | 697 | 697 |
| 2012 | 601 | 616 | 655 | 700 | 576 | 687 | 775 | 901 | 655 | 652 | 549 | 587 |
| 2013 | 579 | 552 | 679 | 584 | 746 | 918 | 978 | 982 | 661 | 787 | 819 | 859 |
| 2014 | 744 | 749 | 860 | 812 | 739 | 832 | 955 | 894 | 920 | 885 | 866 | 883 |
| 2015 | 784 | 763 | 910 | 898 | 874 | 887 | 1,009 | 980 | 826 | 771 | 848 | 851 |
| 2016 | 763 | 838 | 966 | 884 | 904 | 983 | 1,029 | 1,026 | 953 | 955 | 1,057 | 1,053 |
| 2017 | 956 | 848 | 983 | 840 | 943 | 980 | 933 | 974 | 922 | 1,043 | 1,102 | 1,066 |
| 2018 | 945 | 839 | 1,005 | 929 | 949 | 1,097 | 1,088 | 1,000 | 906 | 921 | 935 | 1,039 |
| 2019 | 968 | 822 | 969 | 884 | 892 | 954 | 914 | 901 | 829 | 860 | 921 | 943 |
| 2020 | 931 | 764 | 782 | 400 | 340 | 439 | 563 | 525 | 517 | 516 | 537 | 521 |
| 2021 | 515 | 446 | 563 | 531 | 436 | 520 | 574 | 566 | 490 | 577 | 547 | 572 |
| 2022 | 489 | 444 | 479 | 417 | 400 | 479 | 542 | 484 | 438 | 530 | 532 | 504 |
| 2023 | 515 | 445 | 510 | 535 | 590 | 585 | 548 | 577 | 466 | 539 | 557 | 556 |
| 2024 | 514 | |||||||||||
| - = No Data Reported; -- = Not Applicable; NA = Not Available; W = Withheld to avoid disclosure of individual company data. |
| Release Date: 3/29/2024 |
| Next Release Date: 4/30/2024 |