|
Download Data (XLS File) |
|
||||||||
|
||||||||
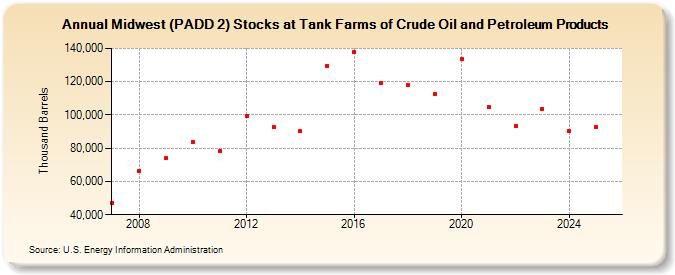
| Midwest (PADD 2) Stocks at Tank Farms of Crude Oil and Petroleum Products (Thousand Barrels) | ||||||||
| Decade | Year-0 | Year-1 | Year-2 | Year-3 | Year-4 | Year-5 | Year-6 | Year-7 | Year-8 | Year-9 |
|---|---|---|---|---|---|---|---|---|---|---|
| 2000's | 47,036 | 66,278 | 74,086 | |||||||
| 2010's | 83,939 | 78,047 | 99,189 | 92,947 | 90,323 | 129,510 | 137,879 | 119,069 | 118,183 | 112,350 |
| 2020's | 133,503 | 104,593 | 93,326 | 103,371 |
| - = No Data Reported; -- = Not Applicable; NA = Not Available; W = Withheld to avoid disclosure of individual company data. |
| Release Date: 3/29/2024 |
| Next Release Date: 8/30/2024 |