|
Download Data (XLS File) |
|
||||||||
|
||||||||
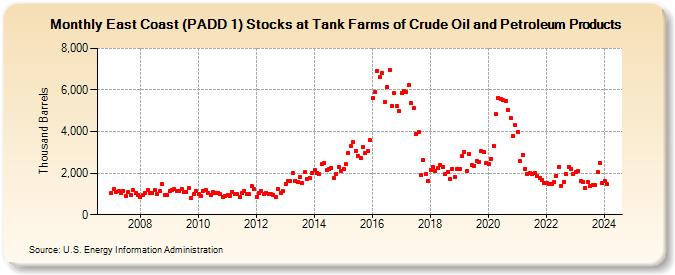
| East Coast (PADD 1) Stocks at Tank Farms of Crude Oil and Petroleum Products (Thousand Barrels) | ||||||||
| Year | Jan | Feb | Mar | Apr | May | Jun | Jul | Aug | Sep | Oct | Nov | Dec |
|---|---|---|---|---|---|---|---|---|---|---|---|---|
| 2007 | 1,046 | 1,219 | 1,079 | 1,128 | 1,042 | 1,155 | 879 | 1,108 | 957 | 1,185 | 1,047 | 925 |
| 2008 | 841 | 930 | 1,059 | 1,186 | 1,050 | 1,068 | 1,178 | 976 | 1,124 | 1,472 | 970 | 970 |
| 2009 | 1,120 | 1,168 | 1,224 | 1,133 | 1,130 | 1,214 | 1,109 | 1,116 | 1,274 | 817 | 976 | 1,123 |
| 2010 | 999 | 887 | 1,157 | 1,189 | 1,049 | 936 | 1,086 | 1,038 | 1,049 | 981 | 863 | 889 |
| 2011 | 943 | 923 | 1,094 | 974 | 994 | 858 | 1,044 | 1,130 | 1,017 | 976 | 1,391 | 1,220 |
| 2012 | 875 | 1,046 | 1,129 | 1,015 | 1,049 | 1,017 | 998 | 951 | 848 | 1,244 | 1,052 | 1,125 |
| 2013 | 1,472 | 1,618 | 1,618 | 2,000 | 1,635 | 1,585 | 1,793 | 1,507 | 2,033 | 1,730 | 1,754 | 2,012 |
| 2014 | 2,143 | 2,030 | 1,951 | 2,436 | 2,498 | 2,144 | 2,185 | 2,240 | 1,782 | 1,968 | 2,304 | 2,118 |
| 2015 | 2,220 | 2,416 | 2,953 | 3,317 | 3,484 | 3,070 | 2,839 | 2,706 | 3,247 | 2,983 | 3,058 | 3,580 |
| 2016 | 5,619 | 5,914 | 6,930 | 6,615 | 6,806 | 5,445 | 6,127 | 6,965 | 5,243 | 5,841 | 5,237 | 4,965 |
| 2017 | 5,861 | 5,962 | 5,893 | 6,220 | 5,361 | 5,109 | 3,892 | 3,958 | 1,907 | 2,621 | 1,956 | 1,641 |
| 2018 | 2,164 | 2,290 | 2,111 | 2,231 | 2,373 | 2,308 | 1,944 | 2,047 | 1,702 | 2,201 | 1,830 | 2,191 |
| 2019 | 2,203 | 2,833 | 3,030 | 2,105 | 2,937 | 2,392 | 2,345 | 2,572 | 2,546 | 3,045 | 3,008 | 2,494 |
| 2020 | 2,448 | 2,672 | 3,300 | 4,828 | 5,594 | 5,573 | 5,498 | 5,474 | 5,044 | 4,645 | 3,778 | 4,299 |
| 2021 | 3,991 | 2,576 | 2,895 | 2,215 | 1,964 | 1,988 | 1,964 | 2,020 | 1,872 | 1,746 | 1,670 | 1,523 |
| 2022 | 1,508 | 1,493 | 1,484 | 1,582 | 1,881 | 2,314 | 1,394 | 1,587 | 1,947 | 2,313 | 2,196 | 1,970 |
| 2023 | 2,058 | 2,104 | 1,599 | 1,563 | 1,298 | 1,573 | 1,405 | 1,449 | 1,407 | 2,059 | 2,509 | 1,515 |
| 2024 | 1,614 | |||||||||||
| - = No Data Reported; -- = Not Applicable; NA = Not Available; W = Withheld to avoid disclosure of individual company data. |
| Release Date: 3/29/2024 |
| Next Release Date: 4/30/2024 |