|
Download Data (XLS File) |
|
||||||||
|
||||||||
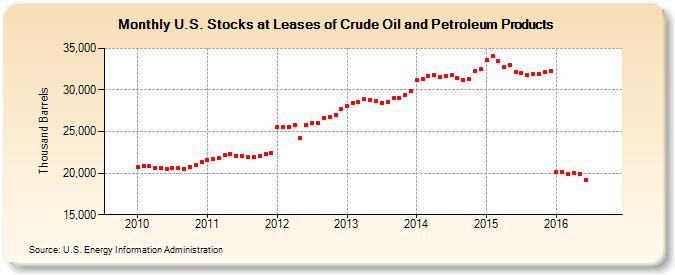
| U.S. Stocks at Leases of Crude Oil and Petroleum Products (Thousand Barrels) | ||||||||
| Year | Jan | Feb | Mar | Apr | May | Jun | Jul | Aug | Sep | Oct | Nov | Dec |
|---|---|---|---|---|---|---|---|---|---|---|---|---|
| 2010 | 20,711 | 20,841 | 20,803 | 20,633 | 20,663 | 20,509 | 20,592 | 20,602 | 20,517 | 20,762 | 21,033 | 21,348 |
| 2011 | 21,586 | 21,653 | 21,792 | 22,128 | 22,277 | 22,064 | 22,048 | 21,944 | 21,942 | 22,053 | 22,271 | 22,458 |
| 2012 | 25,591 | 25,604 | 25,588 | 25,813 | 24,176 | 25,828 | 25,987 | 26,033 | 26,618 | 26,778 | 26,997 | 27,700 |
| 2013 | 28,122 | 28,411 | 28,508 | 28,876 | 28,735 | 28,629 | 28,492 | 28,603 | 29,002 | 29,065 | 29,453 | 29,872 |
| 2014 | 31,155 | 31,369 | 31,669 | 31,781 | 31,572 | 31,706 | 31,743 | 31,451 | 31,170 | 31,270 | 32,320 | 32,476 |
| 2015 | 33,587 | 34,128 | 33,461 | 32,731 | 32,951 | 32,156 | 32,049 | 31,771 | 31,936 | 31,969 | 32,212 | 32,303 |
| 2016 | 20,172 | 20,107 | 19,857 | 20,001 | 19,955 | 19,122 | ||||||
| - = No Data Reported; -- = Not Applicable; NA = Not Available; W = Withheld to avoid disclosure of individual company data. |
| Release Date: 3/29/2024 |
| Next Release Date: 4/30/2024 |