|
Download Data (XLS File) |
|
||||||||
|
||||||||
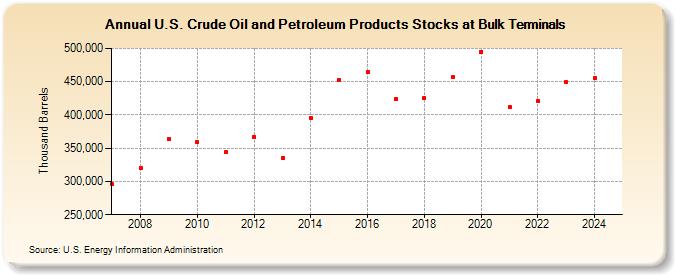
| U.S. Crude Oil and Petroleum Products Stocks at Bulk Terminals (Thousand Barrels) | ||||||||
| Decade | Year-0 | Year-1 | Year-2 | Year-3 | Year-4 | Year-5 | Year-6 | Year-7 | Year-8 | Year-9 |
|---|---|---|---|---|---|---|---|---|---|---|
| 2000's | 295,669 | 320,665 | 364,039 | |||||||
| 2010's | 358,804 | 343,715 | 367,215 | 335,420 | 395,644 | 452,498 | 465,050 | 424,290 | 425,606 | 456,820 |
| 2020's | 495,036 | 411,780 | 421,086 | 449,282 |
| - = No Data Reported; -- = Not Applicable; NA = Not Available; W = Withheld to avoid disclosure of individual company data. |
| Release Date: 3/29/2024 |
| Next Release Date: 8/30/2024 |