|
Download Data (XLS File) |
|
||||||||
|
||||||||
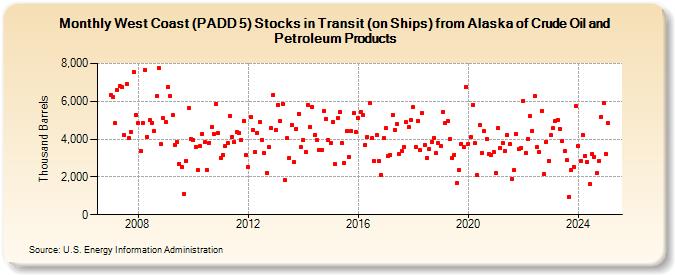
| West Coast (PADD 5) Stocks in Transit (on Ships) from Alaska of Crude Oil and Petroleum Products (Thousand Barrels) | ||||||||
| Year | Jan | Feb | Mar | Apr | May | Jun | Jul | Aug | Sep | Oct | Nov | Dec |
|---|---|---|---|---|---|---|---|---|---|---|---|---|
| 2007 | 6,340 | 6,202 | 4,847 | 6,596 | 6,796 | 6,731 | 4,227 | 6,924 | 4,041 | 4,378 | 7,570 | 5,273 |
| 2008 | 4,850 | 3,392 | 4,865 | 7,676 | 4,134 | 5,001 | 4,864 | 4,429 | 6,265 | 7,737 | 3,725 | 5,097 |
| 2009 | 4,906 | 6,744 | 6,283 | 5,272 | 3,688 | 3,847 | 2,698 | 2,543 | 1,115 | 2,861 | 5,621 | 4,028 |
| 2010 | 3,950 | 3,571 | 2,361 | 3,613 | 4,296 | 3,829 | 2,369 | 3,801 | 4,649 | 4,275 | 5,879 | 4,317 |
| 2011 | 3,014 | 3,155 | 3,631 | 3,812 | 5,243 | 4,114 | 3,821 | 4,374 | 4,298 | 3,968 | 4,975 | 3,151 |
| 2012 | 2,537 | 5,181 | 4,485 | 3,336 | 4,347 | 4,899 | 3,976 | 3,248 | 2,209 | 3,566 | 4,562 | 6,350 |
| 2013 | 4,465 | 5,828 | 4,959 | 5,867 | 1,844 | 4,056 | 3,024 | 4,735 | 2,803 | 4,558 | 5,354 | 3,578 |
| 2014 | 3,955 | 3,330 | 5,814 | 4,652 | 5,685 | 4,227 | 3,971 | 3,440 | 3,447 | 5,492 | 5,068 | 3,951 |
| 2015 | 3,819 | 4,897 | 2,660 | 5,122 | 5,436 | 3,818 | 2,725 | 4,409 | 3,071 | 4,441 | 5,373 | 4,381 |
| 2016 | 5,112 | 5,450 | 5,253 | 3,713 | 4,105 | 5,890 | 4,060 | 2,839 | 4,207 | 2,833 | 2,113 | 4,034 |
| 2017 | 4,576 | 3,081 | 3,170 | 5,284 | 4,495 | 4,775 | 3,231 | 3,346 | 3,588 | 4,897 | 4,619 | 4,993 |
| 2018 | 5,688 | 3,581 | 4,958 | 3,400 | 5,393 | 3,714 | 3,025 | 3,497 | 3,853 | 4,075 | 3,255 | 3,773 |
| 2019 | 3,610 | 5,449 | 4,837 | 4,947 | 3,985 | 2,980 | 3,174 | 1,653 | 2,362 | 3,758 | 3,574 | 6,765 |
| 2020 | 3,738 | 4,092 | 5,825 | 3,776 | 2,077 | 4,742 | 3,287 | 4,421 | 3,995 | 3,200 | 3,183 | 3,323 |
| 2021 | 2,184 | 4,561 | 3,548 | 3,794 | 3,358 | 4,212 | 3,738 | 1,895 | 2,368 | 4,279 | 3,455 | 3,548 |
| 2022 | 6,041 | 3,263 | 3,992 | 5,201 | 4,443 | 6,255 | 3,562 | 3,327 | 5,510 | 2,142 | 3,838 | 2,856 |
| 2023 | 4,194 | 4,568 | 4,950 | 5,033 | 4,543 | 3,891 | 3,349 | 2,868 | 940 | 2,348 | 2,548 | 5,747 |
| 2024 | 3,648 | |||||||||||
| - = No Data Reported; -- = Not Applicable; NA = Not Available; W = Withheld to avoid disclosure of individual company data. |
| Release Date: 3/29/2024 |
| Next Release Date: 4/30/2024 |