|
Download Data (XLS File) |
|
||||||||
|
||||||||
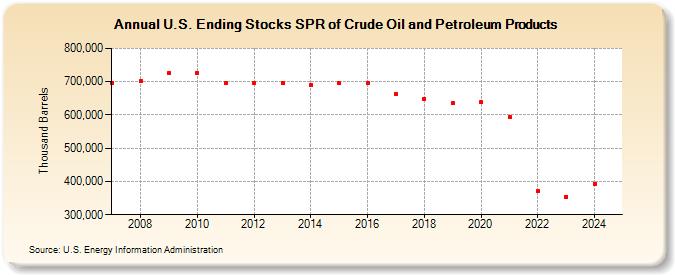
| U.S. Ending Stocks SPR of Crude Oil and Petroleum Products (Thousand Barrels) | ||||||||
| Decade | Year-0 | Year-1 | Year-2 | Year-3 | Year-4 | Year-5 | Year-6 | Year-7 | Year-8 | Year-9 |
|---|---|---|---|---|---|---|---|---|---|---|
| 2000's | 696,941 | 701,823 | 726,616 | |||||||
| 2010's | 726,545 | 695,951 | 695,268 | 695,969 | 690,959 | 695,119 | 695,082 | 662,831 | 649,139 | 634,967 |
| 2020's | 638,086 | 593,682 | 372,030 | 354,684 |
| - = No Data Reported; -- = Not Applicable; NA = Not Available; W = Withheld to avoid disclosure of individual company data. |
| Release Date: 3/29/2024 |
| Next Release Date: 8/30/2024 |