|
Download Data (XLS File) |
|
||||||||
|
||||||||
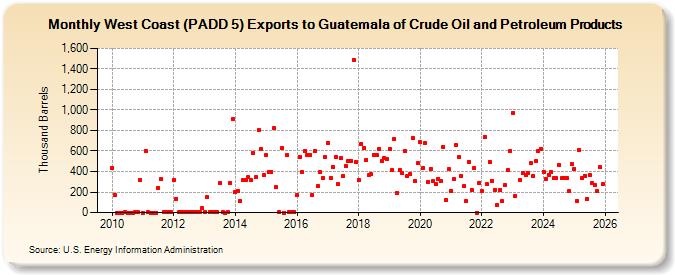
| West Coast (PADD 5) Exports to Guatemala of Crude Oil and Petroleum Products (Thousand Barrels) | ||||||||
| Year | Jan | Feb | Mar | Apr | May | Jun | Jul | Aug | Sep | Oct | Nov | Dec |
|---|---|---|---|---|---|---|---|---|---|---|---|---|
| 2010 | 435 | 174 | 0 | 0 | 0 | 1 | 0 | 0 | 0 | 1 | 1 | 315 |
| 2011 | 0 | 598 | 1 | 0 | 0 | 0 | 240 | 324 | 1 | 1 | 2 | 1 |
| 2012 | 317 | 135 | 2 | 1 | 2 | 1 | 1 | 2 | 1 | 2 | 1 | 41 |
| 2013 | 2 | 151 | 1 | 1 | 2 | 1 | 287 | 1 | 0 | 2 | 287 | 912 |
| 2014 | 199 | 211 | 111 | 314 | 319 | 343 | 317 | 579 | 347 | 804 | 623 | 366 |
| 2015 | 561 | 395 | 400 | 821 | 247 | 1 | 628 | 0 | 561 | 1 | 1 | 2 |
| 2016 | 168 | 542 | 399 | 598 | 563 | 560 | 169 | 600 | 261 | 391 | 337 | 540 |
| 2017 | 678 | 337 | 447 | 539 | 278 | 528 | 356 | 455 | 505 | 506 | 1,491 | 493 |
| 2018 | 317 | 670 | 629 | 516 | 362 | 372 | 565 | 557 | 622 | 507 | 535 | 522 |
| 2019 | 621 | 414 | 717 | 191 | 415 | 381 | 600 | 361 | 377 | 727 | 308 | 479 |
| 2020 | 686 | 439 | 675 | 299 | 428 | 306 | 275 | 330 | 306 | 641 | 125 | 420 |
| 2021 | 209 | 328 | 659 | 541 | 355 | 256 | 109 | 497 | 221 | 435 | 0 | 291 |
| 2022 | 212 | 740 | 275 | 497 | 309 | 224 | 70 | 222 | 108 | 267 | 414 | 601 |
| 2023 | 971 | 162 | 316 | 386 | 369 | 385 | 480 | 354 | 501 | 596 | 620 | |
| 2024 | 398 | |||||||||||
| - = No Data Reported; -- = Not Applicable; NA = Not Available; W = Withheld to avoid disclosure of individual company data. |
| Release Date: 3/29/2024 |
| Next Release Date: 4/30/2024 |