|
Download Data (XLS File) |
|
||||||||
|
||||||||
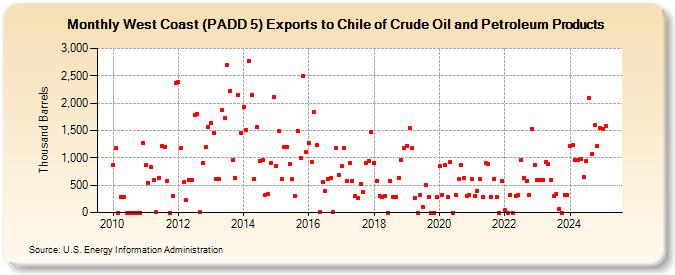
| West Coast (PADD 5) Exports to Chile of Crude Oil and Petroleum Products (Thousand Barrels) | ||||||||
| Year | Jan | Feb | Mar | Apr | May | Jun | Jul | Aug | Sep | Oct | Nov | Dec |
|---|---|---|---|---|---|---|---|---|---|---|---|---|
| 2010 | 867 | 1,178 | 1 | 287 | 287 | 1 | 1 | 1 | 1 | 1 | 1 | 1,271 |
| 2011 | 860 | 539 | 840 | 589 | 8 | 629 | 1,217 | 1,191 | 579 | 1 | 297 | 2,364 |
| 2012 | 2,379 | 1,187 | 554 | 223 | 604 | 599 | 1,788 | 1,802 | 3 | 911 | 1,202 | 1,566 |
| 2013 | 1,644 | 1,454 | 612 | 615 | 1,881 | 1,736 | 2,699 | 2,222 | 960 | 632 | 2,155 | 1,459 |
| 2014 | 1,927 | 1,505 | 2,773 | 2,145 | 618 | 1,559 | 949 | 957 | 324 | 331 | 897 | 2,111 |
| 2015 | 857 | 1,499 | 618 | 1,202 | 1,194 | 889 | 612 | 307 | 1,495 | 998 | 2,492 | 1,110 |
| 2016 | 1,277 | 922 | 1,836 | 1,232 | 2 | 555 | 387 | 619 | 634 | 2 | 1,177 | 693 |
| 2017 | 856 | 1,177 | 568 | 899 | 582 | 298 | 264 | 514 | 383 | 904 | 947 | 1,465 |
| 2018 | 911 | 577 | 294 | 281 | 301 | 1 | 574 | 276 | 288 | 639 | 956 | 1,175 |
| 2019 | 1,225 | 1,545 | 1,186 | 273 | 1 | 322 | 102 | 512 | 277 | 1 | 1 | 279 |
| 2020 | 854 | 314 | 864 | 287 | 927 | 0 | 323 | 605 | 869 | 640 | 301 | 317 |
| 2021 | 605 | 302 | 385 | 606 | 292 | 903 | 881 | 289 | 616 | 292 | 0 | 568 |
| 2022 | 40 | 0 | 323 | 0 | 300 | 321 | 957 | 636 | 579 | 316 | 1,535 | 860 |
| 2023 | 591 | 600 | 594 | 915 | 895 | 600 | 300 | 335 | 63 | 0 | 320 | 320 |
| 2024 | 1,220 | |||||||||||
| - = No Data Reported; -- = Not Applicable; NA = Not Available; W = Withheld to avoid disclosure of individual company data. |
| Release Date: 3/29/2024 |
| Next Release Date: 4/30/2024 |