|
Download Data (XLS File) |
|
||||||||
|
||||||||
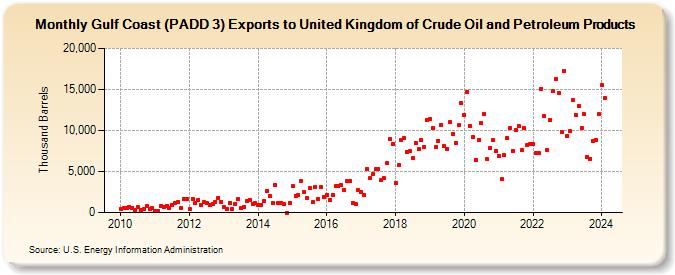
| Gulf Coast (PADD 3) Exports to United Kingdom of Crude Oil and Petroleum Products (Thousand Barrels) | ||||||||
| Year | Jan | Feb | Mar | Apr | May | Jun | Jul | Aug | Sep | Oct | Nov | Dec |
|---|---|---|---|---|---|---|---|---|---|---|---|---|
| 2010 | 492 | 530 | 538 | 693 | 586 | 290 | 633 | 284 | 375 | 765 | 386 | 521 |
| 2011 | 144 | 173 | 799 | 714 | 844 | 605 | 895 | 1,122 | 1,297 | 524 | 1,664 | 1,671 |
| 2012 | 391 | 1,707 | 1,139 | 1,538 | 905 | 1,287 | 1,163 | 981 | 1,011 | 1,288 | 1,820 | 1,339 |
| 2013 | 622 | 432 | 1,202 | 441 | 1,089 | 1,647 | 568 | 723 | 1,468 | 1,578 | 1,070 | 1,104 |
| 2014 | 937 | 882 | 1,397 | 2,603 | 1,985 | 1,220 | 3,372 | 1,196 | 1,219 | 1,064 | 0 | 1,193 |
| 2015 | 3,182 | 2,057 | 2,117 | 3,811 | 2,451 | 1,796 | 2,955 | 1,234 | 3,145 | 1,648 | 3,112 | 1,861 |
| 2016 | 2,152 | 1,506 | 2,156 | 3,224 | 3,269 | 3,319 | 2,736 | 3,823 | 3,850 | 1,203 | 1,049 | 2,714 |
| 2017 | 2,500 | 2,171 | 5,324 | 4,162 | 4,739 | 5,249 | 5,255 | 3,906 | 4,203 | 6,018 | 8,942 | 8,401 |
| 2018 | 3,624 | 5,778 | 8,890 | 9,062 | 7,416 | 7,526 | 6,672 | 8,486 | 7,720 | 8,838 | 8,018 | 11,266 |
| 2019 | 11,368 | 10,312 | 7,992 | 8,755 | 10,708 | 8,058 | 7,798 | 11,019 | 9,520 | 8,483 | 10,662 | 13,354 |
| 2020 | 11,878 | 14,689 | 10,600 | 9,180 | 6,410 | 8,870 | 10,924 | 11,995 | 6,488 | 7,874 | 8,823 | 7,460 |
| 2021 | 6,943 | 4,028 | 7,001 | 9,142 | 10,314 | 7,542 | 10,117 | 10,585 | 7,608 | 10,260 | 8,243 | 8,402 |
| 2022 | 8,301 | 7,258 | 7,302 | 15,110 | 11,791 | 7,580 | 11,326 | 14,755 | 16,214 | 14,571 | 9,794 | 17,300 |
| 2023 | 9,313 | 9,883 | 13,655 | 11,889 | 13,034 | 10,333 | 11,987 | 6,757 | 6,567 | 8,735 | 8,847 | 11,969 |
| 2024 | 15,532 | |||||||||||
| - = No Data Reported; -- = Not Applicable; NA = Not Available; W = Withheld to avoid disclosure of individual company data. |
| Release Date: 3/29/2024 |
| Next Release Date: 4/30/2024 |