|
Download Data (XLS File) |
|
||||||||
|
||||||||
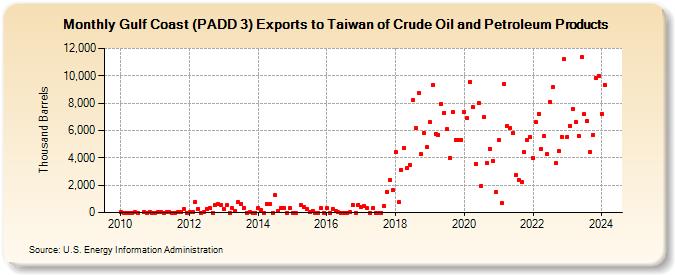
| Gulf Coast (PADD 3) Exports to Taiwan of Crude Oil and Petroleum Products (Thousand Barrels) | ||||||||
| Year | Jan | Feb | Mar | Apr | May | Jun | Jul | Aug | Sep | Oct | Nov | Dec |
|---|---|---|---|---|---|---|---|---|---|---|---|---|
| 2010 | 7 | 0 | 0 | 0 | 0 | 22 | 0 | 33 | 0 | 24 | 0 | |
| 2011 | 0 | 46 | 32 | 0 | 42 | 34 | 0 | 0 | 23 | 23 | 272 | 0 |
| 2012 | 38 | 75 | 781 | 276 | 4 | 34 | 284 | 338 | 0 | 556 | 604 | 577 |
| 2013 | 237 | 535 | 3 | 308 | 126 | 750 | 632 | 326 | 1 | 15 | 0 | 0 |
| 2014 | 349 | 159 | 0 | 629 | 621 | 0 | 1,273 | 142 | 334 | 310 | 0 | 305 |
| 2015 | 0 | 0 | 589 | 411 | 263 | 49 | 145 | 0 | 0 | 321 | 0 | |
| 2016 | 330 | 0 | 270 | 133 | 18 | 0 | 0 | 1 | 14 | 581 | 0 | 578 |
| 2017 | 436 | 477 | 299 | 0 | 297 | 0 | 0 | 0 | 460 | 1,525 | 2,392 | 1,620 |
| 2018 | 4,405 | 741 | 3,138 | 4,742 | 3,230 | 3,509 | 8,199 | 6,147 | 8,752 | 4,246 | 5,797 | 4,783 |
| 2019 | 6,591 | 9,295 | 5,770 | 5,700 | 7,949 | 7,313 | 6,082 | 4,002 | 7,350 | 5,332 | 5,331 | 5,339 |
| 2020 | 7,333 | 6,877 | 9,570 | 7,699 | 3,569 | 7,992 | 1,935 | 6,951 | 3,626 | 4,682 | 3,756 | 1,469 |
| 2021 | 5,297 | 696 | 9,381 | 6,326 | 6,177 | 5,782 | 2,709 | 2,370 | 2,234 | 4,413 | 5,331 | 5,534 |
| 2022 | 3,961 | 6,589 | 7,235 | 4,643 | 5,564 | 4,256 | 8,111 | 9,142 | 3,597 | 4,503 | 5,557 | 11,193 |
| 2023 | 5,557 | 6,350 | 7,571 | 6,622 | 5,630 | 11,346 | 7,170 | 6,683 | 4,444 | 5,688 | 9,849 | 9,999 |
| 2024 | 7,228 | |||||||||||
| - = No Data Reported; -- = Not Applicable; NA = Not Available; W = Withheld to avoid disclosure of individual company data. |
| Release Date: 3/29/2024 |
| Next Release Date: 4/30/2024 |