|
Download Data (XLS File) |
|
||||||||
|
||||||||
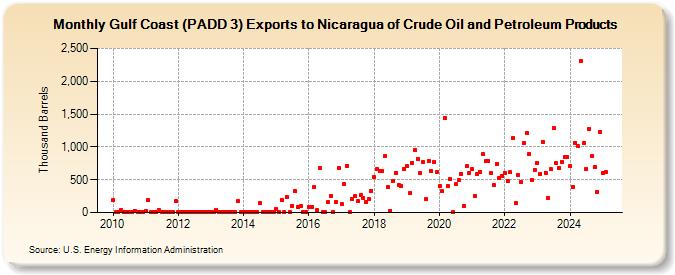
| Gulf Coast (PADD 3) Exports to Nicaragua of Crude Oil and Petroleum Products (Thousand Barrels) | ||||||||
| Year | Jan | Feb | Mar | Apr | May | Jun | Jul | Aug | Sep | Oct | Nov | Dec |
|---|---|---|---|---|---|---|---|---|---|---|---|---|
| 2010 | 184 | 3 | 8 | 38 | 5 | 4 | 3 | 4 | 29 | 4 | 4 | 4 |
| 2011 | 18 | 187 | 6 | 6 | 6 | 35 | 4 | 5 | 4 | 3 | 4 | 173 |
| 2012 | 4 | 4 | 6 | 7 | 8 | 6 | 5 | 3 | 7 | 8 | 9 | 6 |
| 2013 | 4 | 5 | 36 | 5 | 11 | 6 | 5 | 5 | 6 | 7 | 171 | 5 |
| 2014 | 7 | 5 | 3 | 5 | 3 | 5 | 142 | 5 | 5 | 5 | 4 | 4 |
| 2015 | 54 | 3 | 192 | 4 | 243 | 4 | 105 | 325 | 84 | 104 | 6 | 4 |
| 2016 | 85 | 87 | 385 | 35 | 676 | 3 | 6 | 155 | 259 | 3 | 159 | 673 |
| 2017 | 126 | 429 | 716 | 12 | 206 | 246 | 172 | 269 | 218 | 168 | 203 | 333 |
| 2018 | 539 | 660 | 640 | 635 | 856 | 389 | 31 | 484 | 610 | 421 | 402 | 670 |
| 2019 | 702 | 301 | 761 | 954 | 822 | 606 | 767 | 202 | 784 | 632 | 771 | 612 |
| 2020 | 401 | 322 | 1,437 | 402 | 506 | 2 | 432 | 493 | 587 | 107 | 703 | 603 |
| 2021 | 657 | 259 | 592 | 620 | 890 | 784 | 787 | 596 | 415 | 745 | 521 | 562 |
| 2022 | 605 | 483 | 613 | 1,132 | 145 | 575 | 461 | 1,056 | 1,209 | 894 | 497 | 651 |
| 2023 | 760 | 588 | 1,081 | 606 | 218 | 657 | 1,292 | 748 | 679 | 775 | 840 | 839 |
| 2024 | 702 | 395 | 1,065 | 1,006 | 2,305 | 1,057 | ||||||
| - = No Data Reported; -- = Not Applicable; NA = Not Available; W = Withheld to avoid disclosure of individual company data. |
| Release Date: 8/30/2024 |
| Next Release Date: 9/30/2024 |